• Skip to primary navigation
  • Skip to main content
  • Skip to primary sidebar
  • Skip to footer

Options and Traders Network

Supercharge Your Wealth!

  • Angel Portfolio
  • Tools
  • Reports

Trades

The Ultimate Battle Tested Strategy to Win Against a Market Full of Uncertainty Made Simple and Easy

April 25, 2020 by OptionsAndTraders

Hey guys, today is April 25th, 2020!

I have been collecting data, and conducting my own market research on the stock market for the past 3 weeks.

There is a lot of uncertainty regarding the direction of the stock market, and that seems to be an obstacle for a lot of traders. I am going to present my ultimate battle tested strategy in this article.

This strategy is the absolute conclusion of my experience within the past 3 weeks. I have been testing these strategies with real money and paper trading. I have conducted about 100 trades in the past 3 weeks. As an experienced trader, I have absolute confidence that these conclusions will hold true, and I will continually test them in the weeks to come.

A Chinese general who helped conquer the Qing Dynasty said one thing that I will always keep in my mind,

” If your battle strategy has worked in the past and it is currently failing, it doesn’t mean that your battle strategy doesn’t work. It means that the timing and execution of your strategy needs a slight alteration”

Let’s dive in.

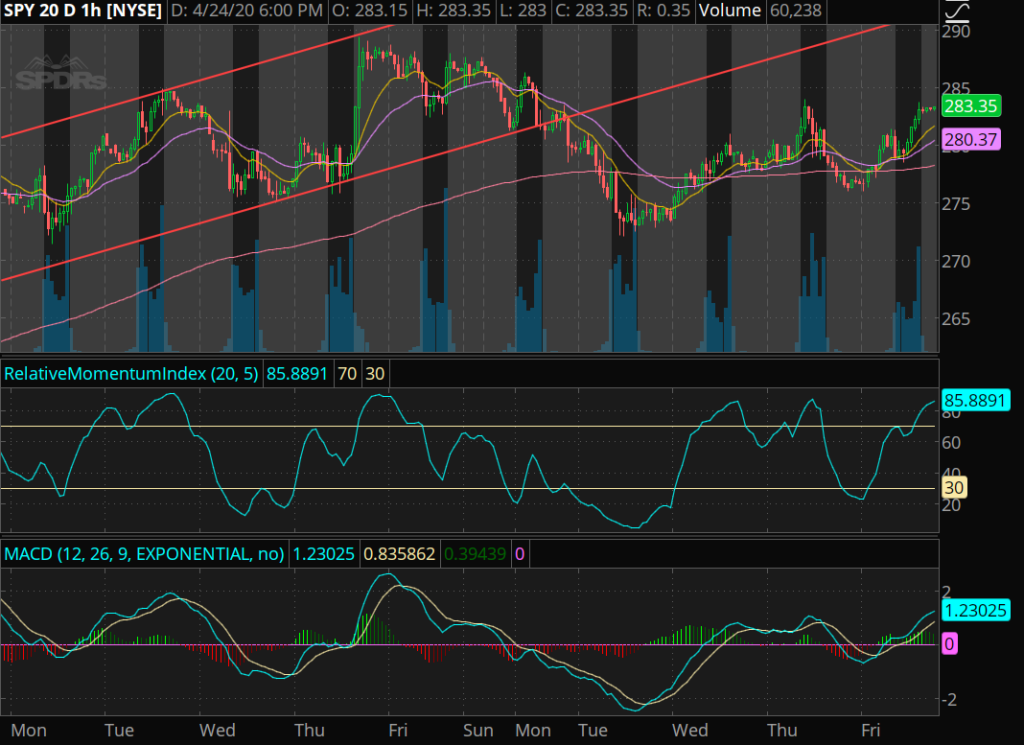
There are two things you want to view before beginning your trading day. I highly suggest that you view them prior to the opening bell. These two things are the VXX Barclays iPath of volatility, and the SPY SPDRs ETF S&P500. The tickers are simply VXX and SPY.

The VXX should start declining as the SPY is increasing. The opposite holds true if the SPY is decreasing.

Let’s take a look at these two charts:
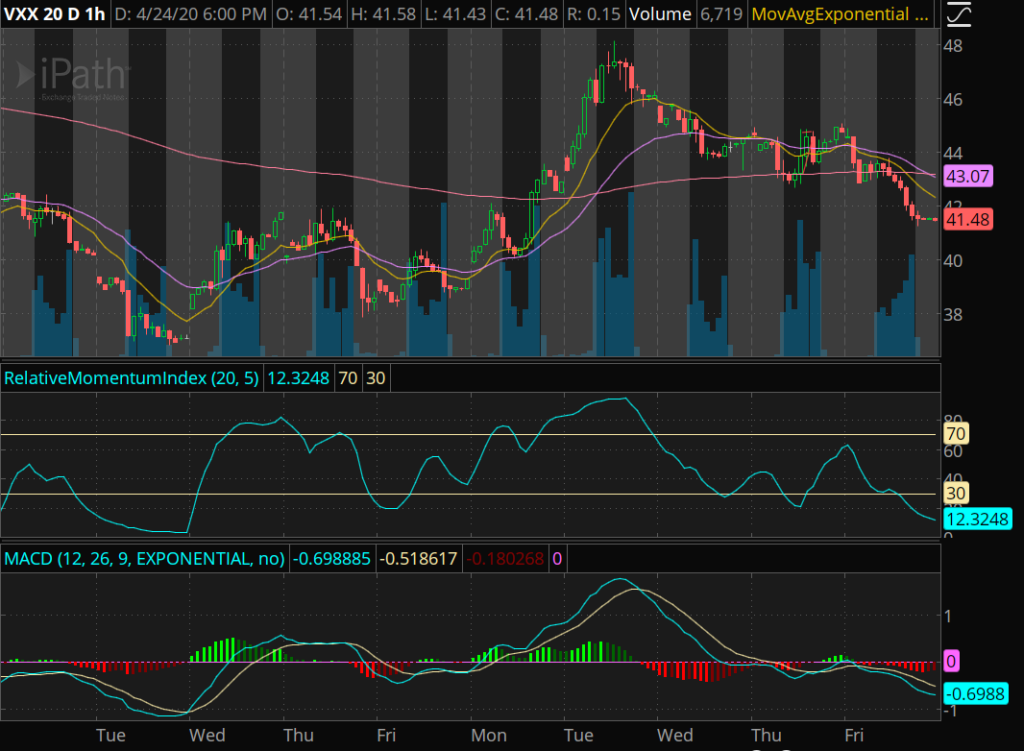
Source: thinkorswim
Source: thinkorswim

Based on all the trading elements depicted in my videos, you can see that as one goes down, the other goes up. This holds true for all of the trading elements.

This is a very important concept to know like the back of your hand.

If you are trading a S&P 500 stock, for the most part, it should be following the trend of the SPY. If the SPY is going up, that ticker should be going up. Make sure that the VXX is going down.

If there is uncertainty in the market, you can easily identify this by seeing if the VXX is going up or down and the SPY is going sideways.

This is also true if the SPY is going up or down, and the VXX is going sideways.

By understanding the gravitational theory that I have presented in my previous articles, you can see that on Friday 4/24/20, the VXX yellow and purple lines have crossed through the gravitational pink line, and they are heading downwards. This is a heavy indication that the SPY will make a move upwards.

As you can see on the same date, the SPY has made a heavy bounce above the gravitational pink line. (This is the OPPOSITE reaction).

This concept is very important when deciding whether to buy options calls or puts on a stock.

How does this help you? It’s quite simple.

Buy calls when the SPY is going up and the VXX is going down. Buy puts when the SPY is going down and the VXX is going up.

I am going to identify some special case scenarios that you need to watch out for.

First, let me identify two types of days on the stock market.

Red days and Green days.

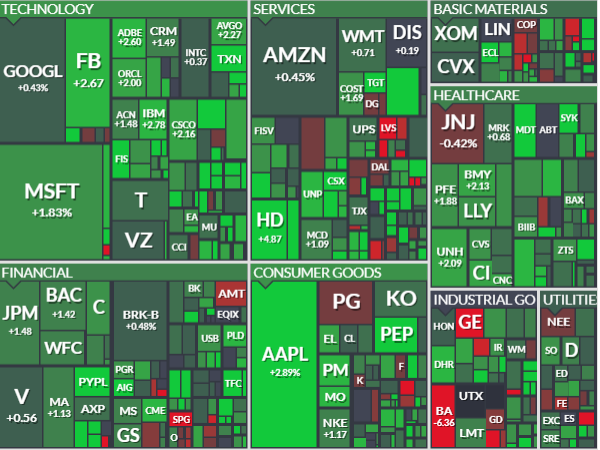
I use finviz to clearly see, within 1 second, what type of day it is.

Red means the overall market is crashing. Green means the overall market is going up.

Take a look at these two pictures:
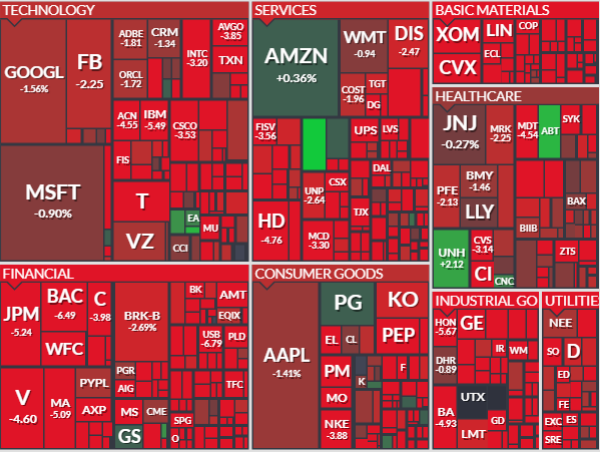
Source: finviz RED DAY
Source: finviz GREEN DAY

These two pictures clearly identify how the day is going.

I am going to explain some simple psychology concepts based on the type of day the market is having.

First know this, the media is controlled by large banks and huge institutional funds. They are the “game master” they can pump any type of news into the world to force the market to go a specific way which will ALWAYS be in their favor for maximizing profit.

If you open finviz and you see a red day. The market is crashing, most likely due to bad news or some type of panic about the Coronavirus and economy.

Following bad news, this next scenario holds true about 90% of the time.

Day 1, the market crashes. Day 2, people who didn’t have their stop losses popped begin to panic as they see their portfolios lose money. These people “Guh” and begin selling, and this causes the domino effect to crash the economy out of fear.

By understanding the psychology of these traders, you can do 3 things.

  1. If you purchased a call that is going upwards against the market trend, take the day trade.
  2. Buy puts on day 1 of the crash, because day 2 will be another crash.
  3. Wait till day 2 and buy calls, because the market will recover as profits become maximized.

If you open finviz and you see a green day. The market is being pumped up, this is most likely due to the institutions picking up cheap stocks and drastically limiting the supply which increases the demand.

Following a green day, this next scenario holds true about 90% of the time.

Day 1, the market goes up. Day 2, people see that the market is going up and they begin to buy in. Day 3, the market goes up again as the domino effect occurs (Scenario A).

Day 3 also has another scenario (Scenario B). The market went up really fast after day 2, and people begin to lock in their profits and they start selling.

By understanding the psychology of these traders, you can do 3 things.

  1. Purchase a call on day 1 and swing trade it the next day.
  2. Purchase a call on day 2 and day trade it.
  3. Purchase a put at the end of day 2 or 3.

Make sure to always check the VXX and SPY with respect to each trading day, because that will give you an edge in knowing exactly if the green day is going to follow scenario A or B.

Stay tuned, learn more, ask questions. Become a 6 digit survivor. Check out the live stream.

Get Started Today

Join my robinhood team and get a free stock here

Learn about my Indicators here.

Become a member and learn!

Newsletter Signup

Disclaimer:

I want to point out, I am not a registered investment adviser or broker/dealer. I am a highly profitable options trader who has been successful time after time, and I have changed the lives of many people through the art of trading on the stock market.

– Ken

Filed Under: $500 Challenge, COVID19, Day Trade, Education, Key to Success, Mentor, Millionaire Mindset, Mistakes, Trade Tagged With: Day Trade, Education, Mindset, Trades, Win

How do I Day Trade on the Stock Market and be Successful at it? An Easy Win! Conquer Your Fear!

April 9, 2020 by OptionsAndTraders

I made a day trade on 4/9/20.

Day trading is when you purchase and sell a stock or an option on the same day.

The ratio for this is simple. The total number of purchases is your governor limit. When the total number of sold purchases = total number of purchases, you have reached your governor limit which results in a day trade.

For example, if you purchase 5 shares of a stock and sell 5 shares of a stock in the same day, that is considered a day trade.

If you purchase 5 shares of the stock in the morning, sell 3 shares in the morning, and 2 shares in the afternoon, that is also a day trade.

What if you buy 5 shares and sell only 1 share?

That will still count as a day trade, even though you did not reach the limit of 5 shares, which means you can still sell the remaining 4 shares without going over the one day trade.

If you buy 5 shares, sell 5 shares, then buy 1 share, you would have done two day trades.

One day trade for the 5 purchased 5 sold, and one day trade for the 1 share.

The SEC has a law for pattern day trading which prohibits anyone with less than $25,000 in their account to commit more than 3 day trades in a given week, before being flagged as a pattern day trader.

The SEC day trading rules can be found here:

https://www.sec.gov/fast-answers/answerspatterndaytraderhtm.html

If you are flagged as a day trader, you must abide to this limit, and always maintain $25,000 in your account at the end of the day, or your day trading activity will be limited.

Therefore, if you are just starting out as a trader, be sure to stay under 3 day trades a week.

I typically teach swing trading, but sometimes I do make some day trades.

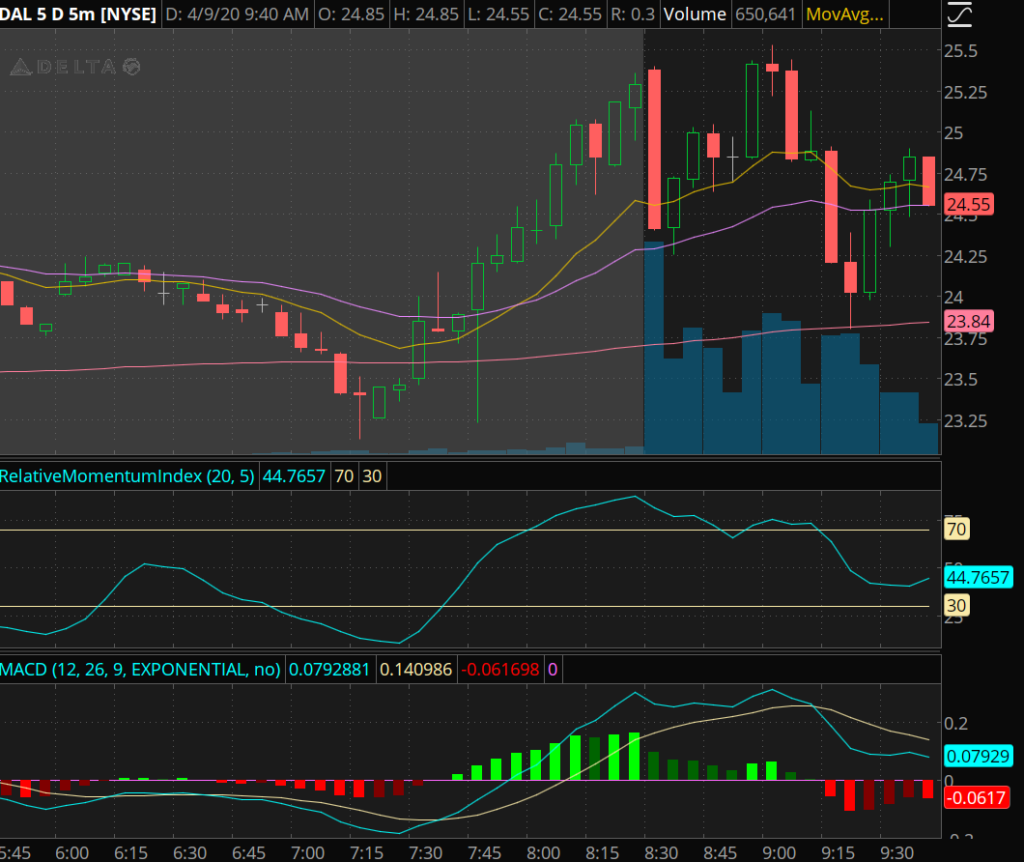
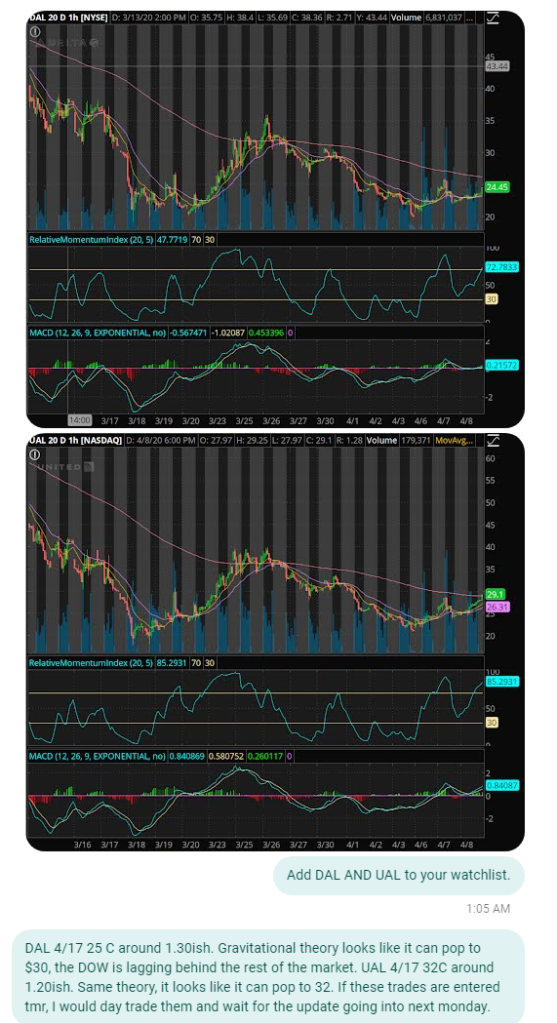
Take a look at the example of the trade I did today on DAL:

This was the alert on 4/8/20.

I used 5 elements to predict the next move in the market:

  1. Gravitational Theory
  2. Catalyst Theory
  3. Support and Resistance
  4. MACD
  5. RSI
Source: thinkorswim

At 8:20 AM CST on 4/9/20, I saw that the stock price popped, and I quickly drew the Fibonacci retracement line.

I saw that the stock was following a bull flag consolidation between $24.71 and $24.97.

I thought to myself, “If the stock price breaks through $24.97, it could send the price up to $25.50, so I alerted my students that the trade should be locked in at $25.50.”

If you would have taken the option call of 4/17 DAL $26 C at 8:40 AM for $150 a contract, you could have made a day trade in 30 minutes for $192 per contract. That is a nice +$42 win per option contract.

In other words, that is 1.28x or a 28% win in 30 minutes. That is definitely way more gains than you would make leaving your money in the bank for one year.

Think about it, you could have took $1000 and turned it into $1280 in 30 minutes!

Source: thinkorswim DAL stock price at $25.50

This is what the chart looked like as the day approached 10:00 AM CST. As you can see, timing is everything! If you were to exit the trade late, you would have loss money.

I hope this provides a valuable lesson for people wanting to learn some day trading techniques.

Stay tuned, learn more, ask questions. Become a 6 digit survivor. Check out the live stream.

Get Started Today

Join my robinhood team and get a free stock here

Learn about my Indicators here.

Become a member and learn!

Newsletter Signup

Disclaimer:

I want to point out, I am not a registered investment adviser or broker/dealer. I am a highly profitable options trader who has been successful time after time, and I have changed the lives of many people through the art of trading on the stock market.

– Ken
Filed Under: DAL, Day Trade, Trade Tagged With: DAL, Day Trade, Trades

What You Should Know About Investing in Banks While Trying to Grow Your Wealth

April 9, 2020 by OptionsAndTraders

Banks are always asking you to invest your money with them. They offer you bonuses, cash back, and other perks to get you to become a member.

You may have fallen for one of these tactics, and I don’t blame you. After all, you do need a bank to house the money you make from your day job.

Have you ever wonder why the banks want you to make an account and deposit your money?

Banks use your hard earned money to play the stock market and generate an enormous amount of wealth while offering you about 1-2% annual interest if you are lucky enough to swing one of those deals.

You can find out how much banks will give you in interest with this tool:

https://www.bankrate.com/banking/savings/rates/

Now that the truth is out. . . Banks NEED your money to make MONEY!

My answer to the question above is:

I never invest in banks, but I might trade their ticker on the stock market. I use their services to temporarily hold my cash as I get paid from my day job. It is a means of transportation for my money. Think of it like public transportation. You have to pay your fare in order to take a ride, and at the end of the day, you might save more money than you would if you drove your own car.

For most of us, we don’t really save or make any money using this form of transportation.

The biggest perk with taking this bus is convenience, you don’t have to drive!

So why am I talking about banks? Well, banks are dependent on your money to make money. The stock price of a bank is directly proportional to the economy, because people store their money in banks when the economy is good; and they take their money out of banks and foolishly invest it all in gold when the economy is bad.

If you read the previous article about the SPY, you will notice that the SPY had a huge squeeze which drove the price higher, and the SPY shows a good representation of how the economy is doing. As of today the SPY hit a high of $276. That is an insane movement for just 1 trading day. This generally implies that the economy is starting to pick back up!

As I was saying, banks are directly proportional to the economy . . .

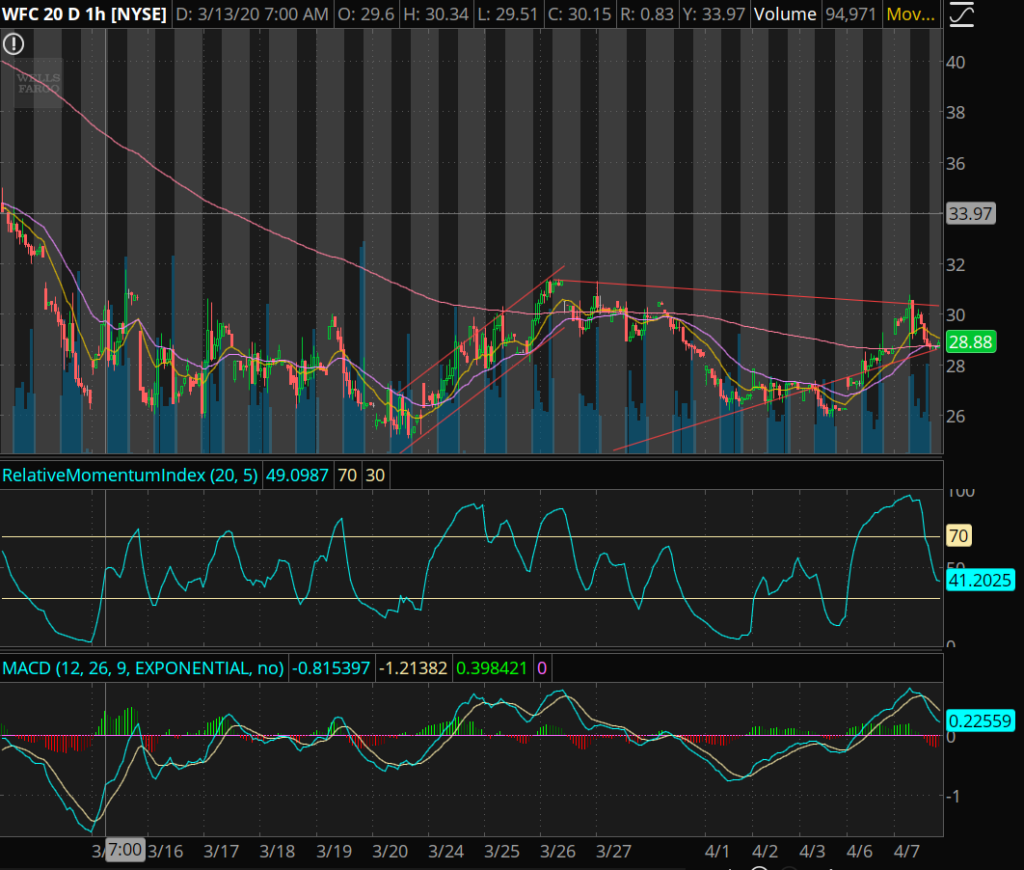
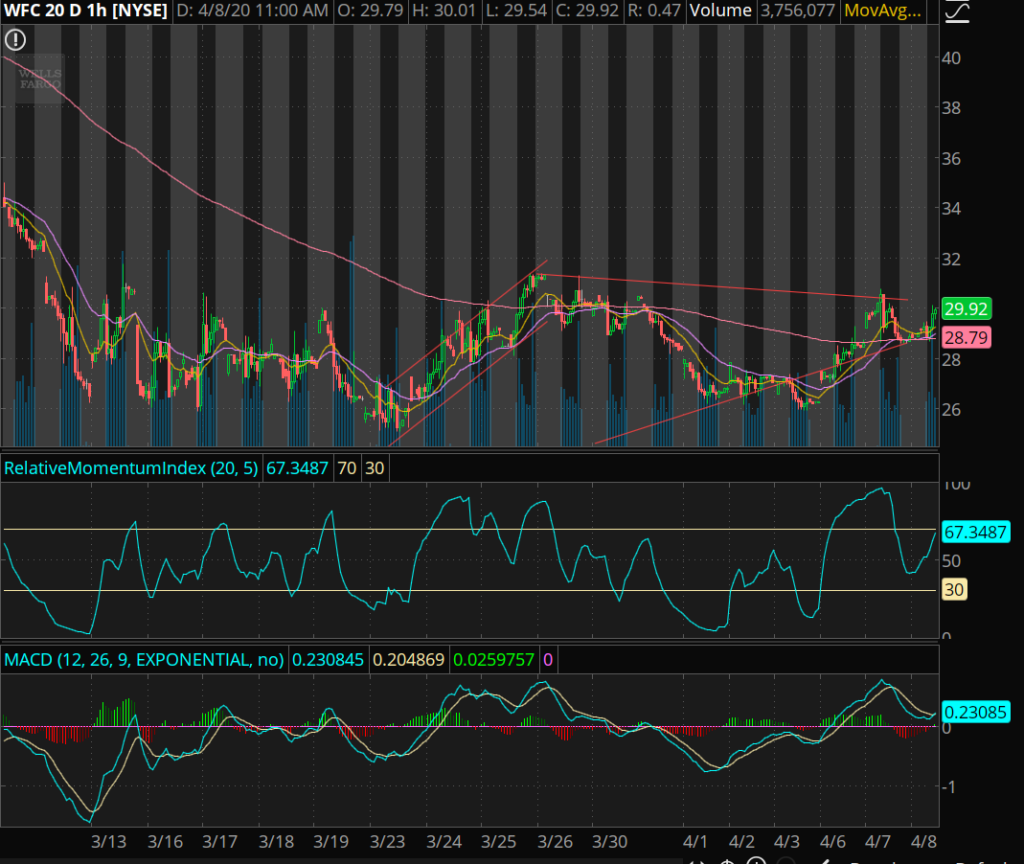
This is a graph of the stock ticker WFC, which is Wells Fargo Bank. I am sure you have heard or seen this company around.

Source: thinkorswim

I used my 5 key elements to pin point this trade alert:

  1. Gravitational Theory
  2. Trend Pattern Squeeze
  3. Support and Resistance
  4. MACD
  5. RSI

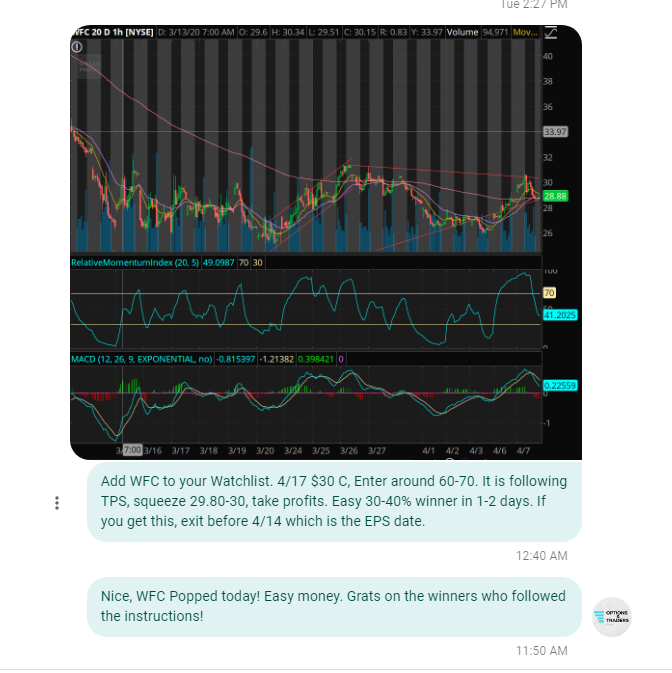
This is what the alert to my students looked like:

This is what happened today:

Source: thinkorswim 4/8/20 11:50 AM CST

BOOM!

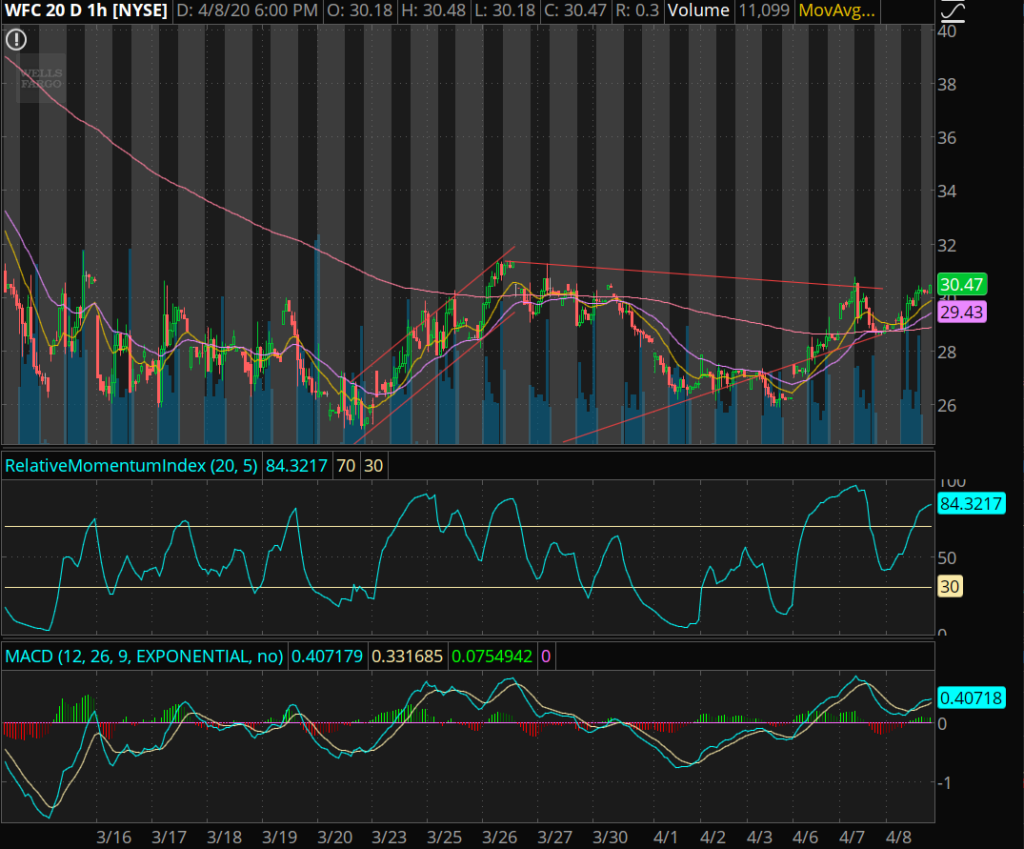
In just one day, the stock popped up way high, it is actually trading after-hours at $30.47. That is an insane movement, so had you gotten this alert and purchased those 4/17 $30 calls for about $60 ea, you would have gotten a $150 return per option contract in 1 day!

Think about it, that is 250% in just 1 day! In other words 2.5x. That is enough to turn $1000 into $2500 in just one day of trading!

My students will be exiting the trade tomorrow and making EASY money!

This is the after-hours graph:

Source: thinkorswim

I look forward to writing a report everyday as my students get closer and closer to making $100,000 this year!

Stay tuned, learn more, ask questions. Become a 6 digit survivor. Check out the live stream.

Get Started Today

Join my robinhood team and get a free stock here

Learn about my Indicators here.

Become a member and learn!

Newsletter Signup

Disclaimer:

I want to point out, I am not a registered investment adviser or broker/dealer. I am a highly profitable options trader who has been successful time after time, and I have changed the lives of many people through the art of trading on the stock market.

– Ken
Filed Under: Banks, SPY Tagged With: Banks, Money, SPY, Trades, WFC

How to Stop Being Broke by Knowing What Direction the Market is Heading

April 8, 2020 by OptionsAndTraders

“Hey! Is the stock market going up or down?”

This is the number one question I get asked every time I mention that I trade stocks and options on the stock market.

My answer is always the same. The market will go where ever the market feels like going, and It doesn’t really matter which direction it is going. All you have to do is know in the short term, what direction the market is going, and exploit the quick gains.

Besides that, it is illegal to have inside information and know exactly which direction the market is heading.

Learn about insider trading here: https://www.investopedia.com/terms/i/insidertrading.asp

Warren Buffet said that the market is a giant pile of money that is constantly getting shuffled around. This is the case for the stock market, people are always putting their money in, and taking their money out. This causes stock prices to fluctuate up and down.

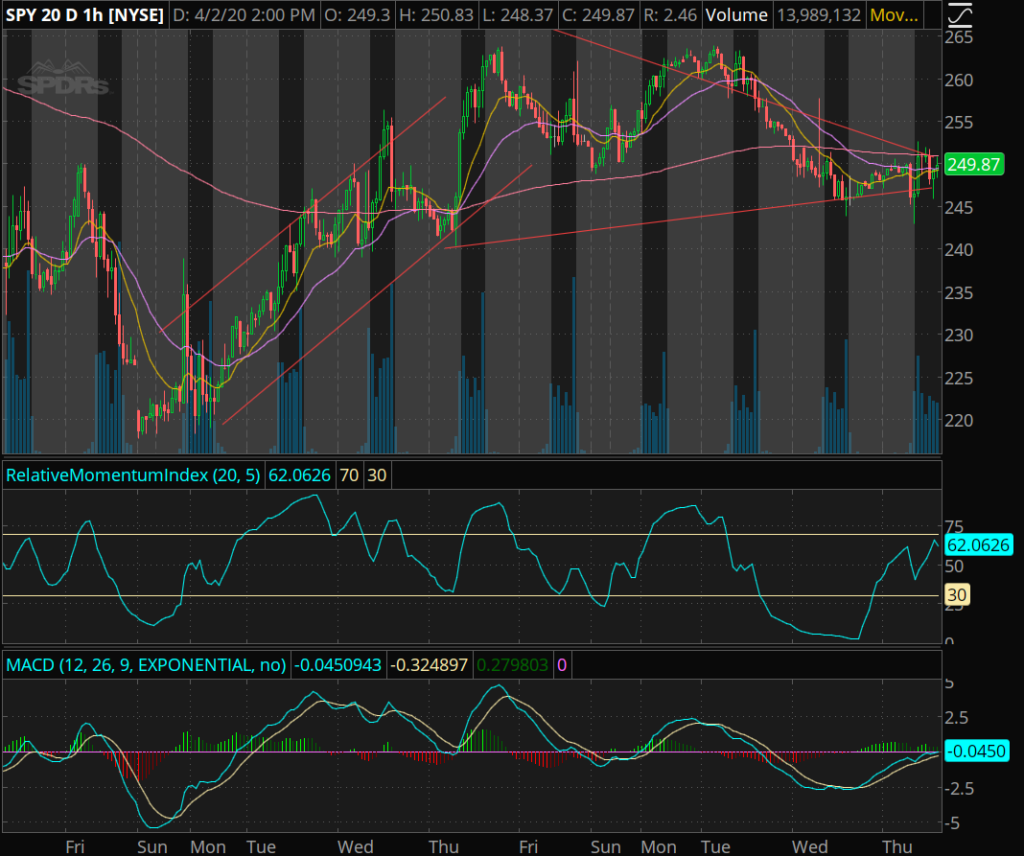
Today, I want to discuss the market as a whole for the past two weeks. The stock ticker SPY is a SPDR ETF which is composed of the top 500 companies listed on the stock market. This is also referred to as the S&P 500. There are other ETFS, but I want to focus on this one, because I use this one to get a feel for which direction I think the market is going next so that I can exploit some easy money and quick wins!

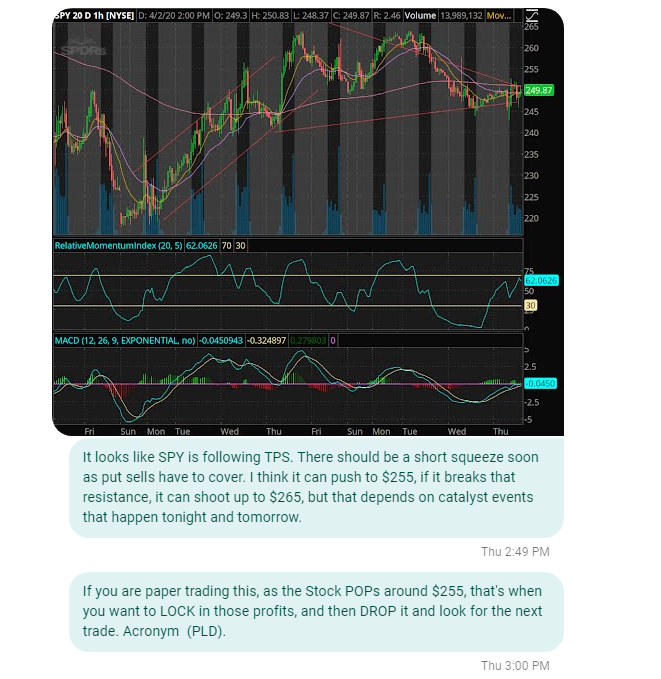
This chart was generated by thinkorswim for the SPY ticker from Friday 3/13/20 to Thursday 4/2/20.

I used 5 elements to identify and predict the next move for this stock.

  1. MACD
  2. RSI
  3. Gravitational Theory
  4. Trend Pattern Squeeze
  5. Support and Resistance

These elements are taught in my short video lectures for students of the January 2020 class. I also teach them on a daily basis as I enter and exit trades.

As soon as I saw these 5 elements, I alerted my students about the trade, and gave clear instructions on what to do. This is a preview of what the alert looked like.

Keep in mind, this is all on 4/2/20.

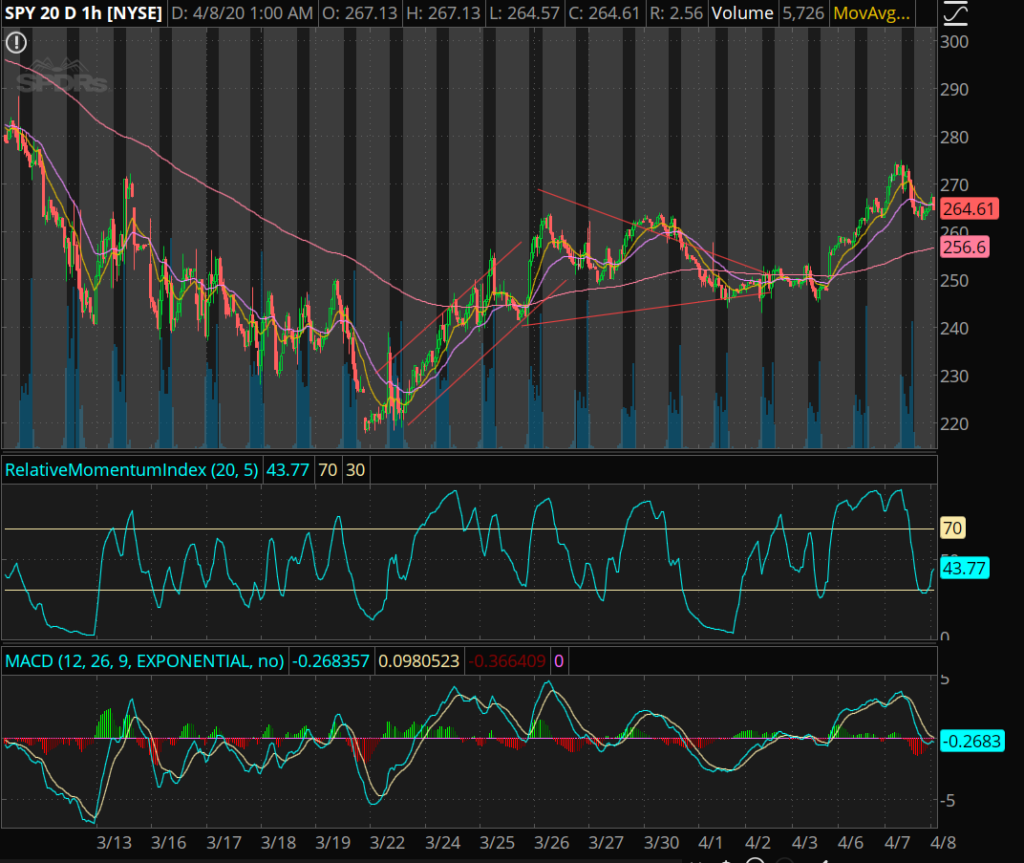
Look at what happened in the next few days.

The SPY followed the squeeze, rapidly exploded to $255 from $249 the very next trading day. The day after, it hit a high of $275! If you would have known that this was going to happen, you could have turned $400 into $2400 in 3 days by playing the call option on the 4/17 SPY $255 C.

Keep in mind, that is a 600% win per option contract. If you had $2000 or 5 contracts, this would have turned into $12,000 in 3 days!

Overall, I am very happy that some of my students were able to make use of the short squeeze and make some quick and easy money!

Happy Trading! I will try and regularly write reports similar to this so that we can have a journal of all our trades throughout the year.

Stay tuned, learn more, ask questions. Become a 6 digit survivor. Check out the live stream.

Get Started Today

Join my robinhood team and get a free stock here

Learn about my Indicators here.

Become a member and learn!

Newsletter Signup

Disclaimer:

I want to point out, I am not a registered investment adviser or broker/dealer. I am a highly profitable options trader who has been successful time after time, and I have changed the lives of many people through the art of trading on the stock market.

– Ken
Filed Under: SPY Tagged With: ETFS, SPY, Stock Market, Trades

  • « Go to Previous Page
  • Go to page 1
  • Go to page 2
  • Go to page 3

Primary Sidebar

Footer

Mission

Our goal is to create a dense network of like minded investors who want to share ideas and learn together.

Content

Our team will teach you how to become an angel investor and a stock trader to help you achieve the success you truly deserve.

Philosophy

We help ordinary people build their wealth from the ground up, because everyone deserves to win.

Copyright © 2025 · Options and Traders Network