• Skip to primary navigation
  • Skip to main content
  • Skip to primary sidebar
  • Skip to footer

Options and Traders Network

Supercharge Your Wealth!

  • Angel Portfolio
  • Tools
  • Reports

SPY

How this Post-Covid Stock Refresher Training Will Help You Become More Profitable FAST!

May 10, 2021 by OptionsAndTraders

Hey guys!

Covid is finally dying out and things are beginning to open back up! I wanted to release a refresher to make sure you are keeping up with your homework on the stock market!

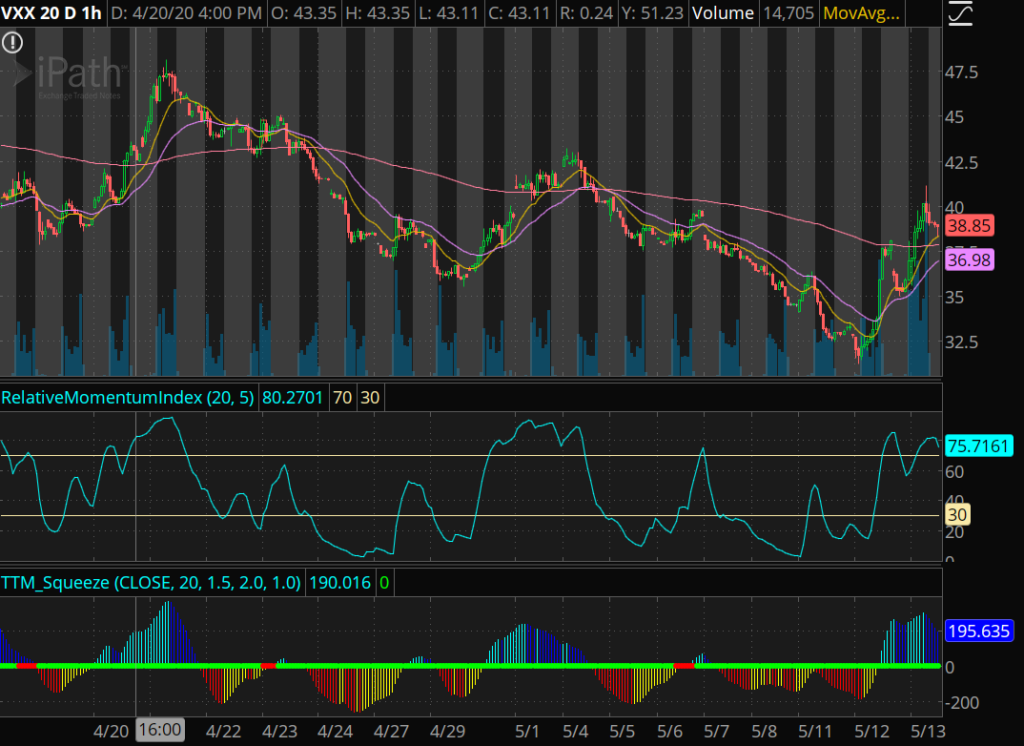
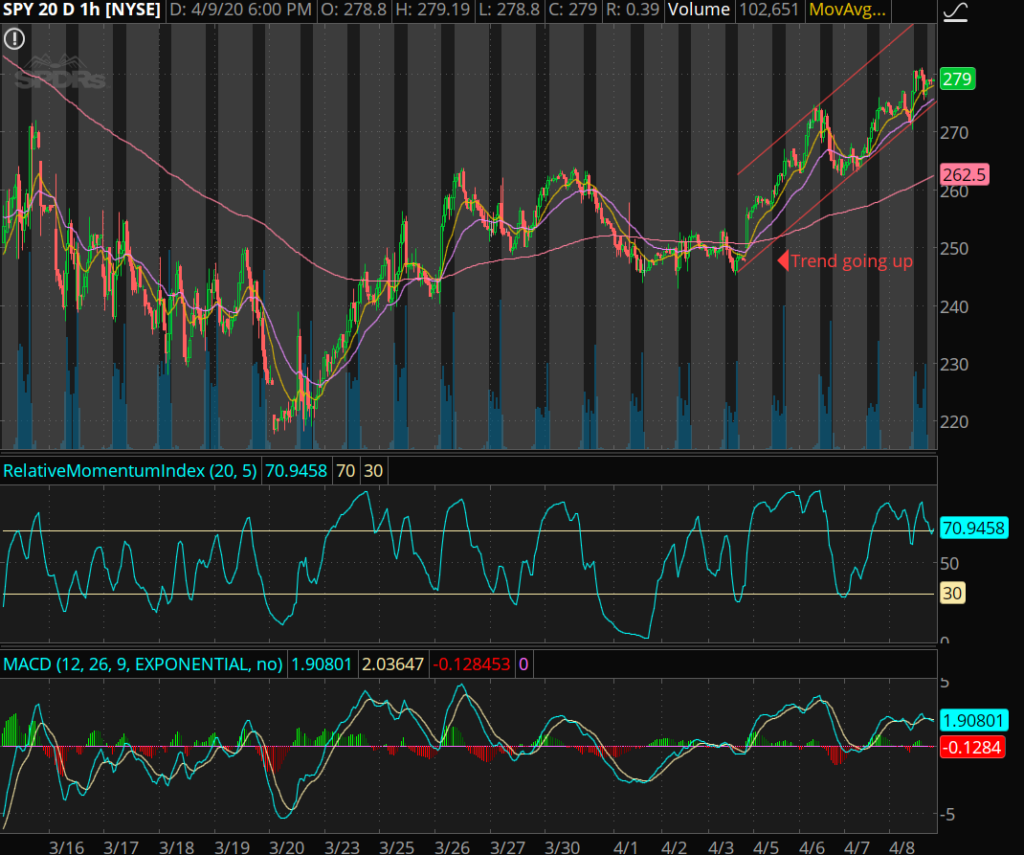
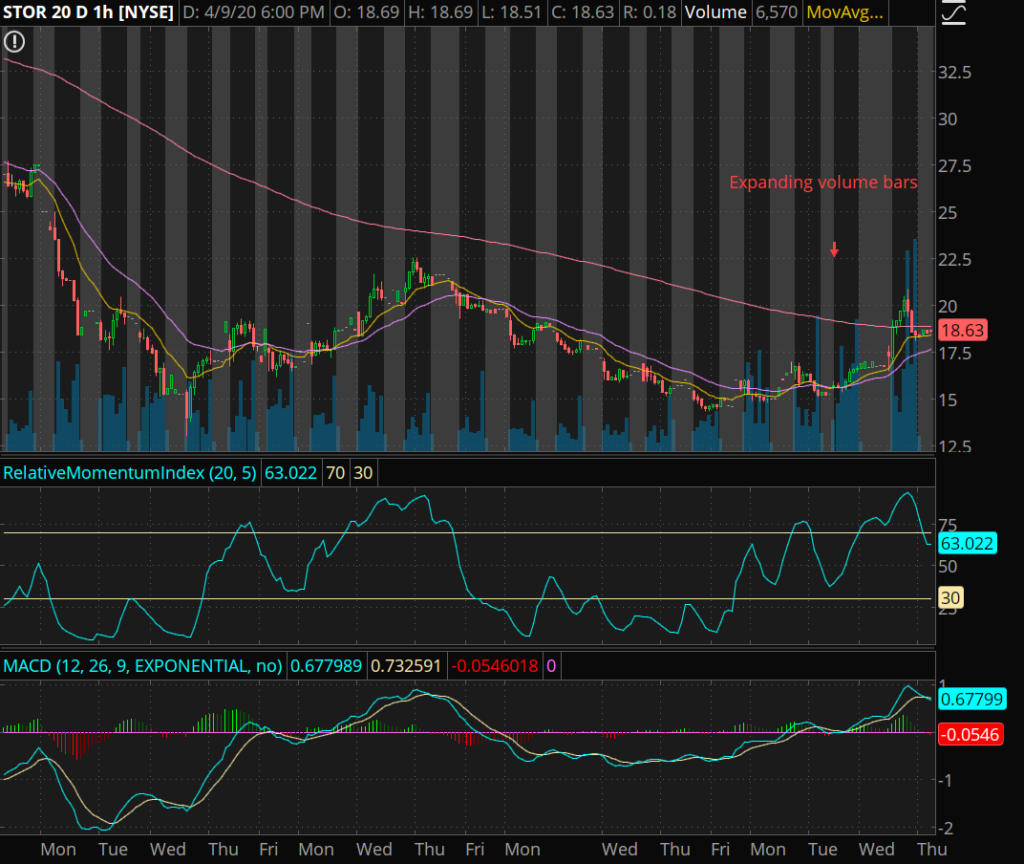
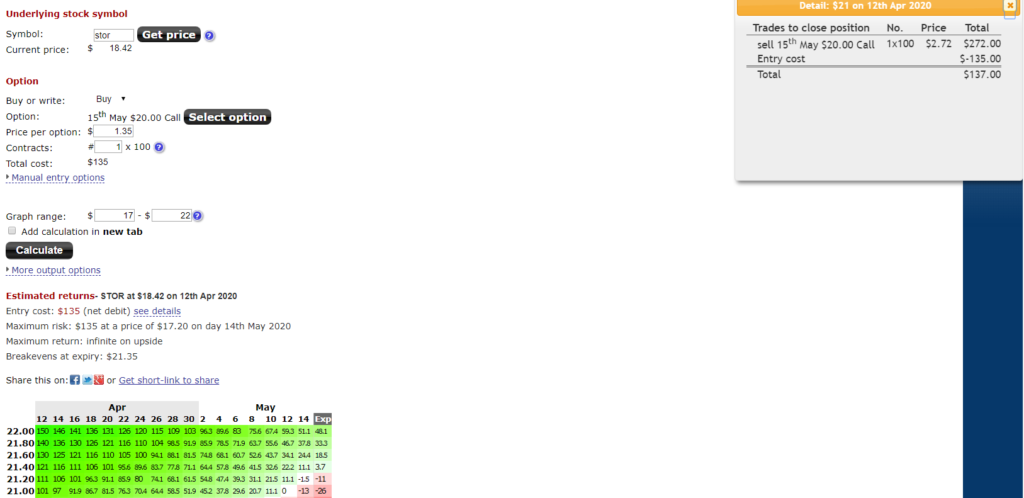
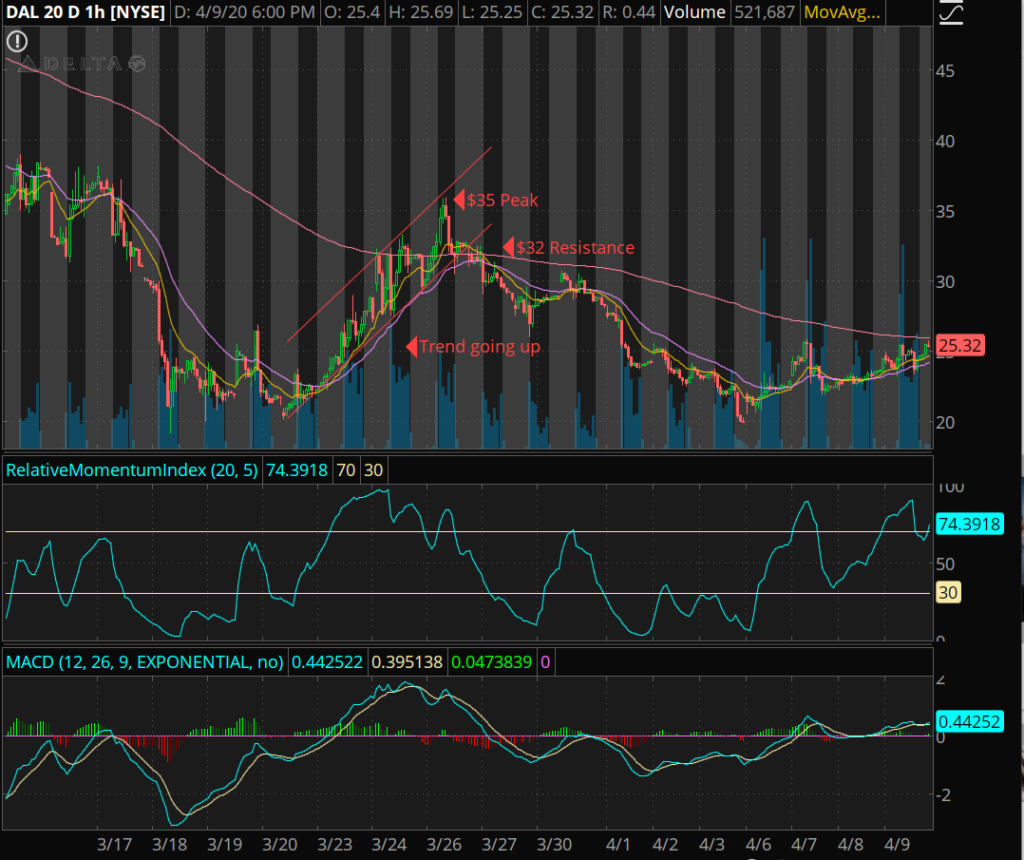
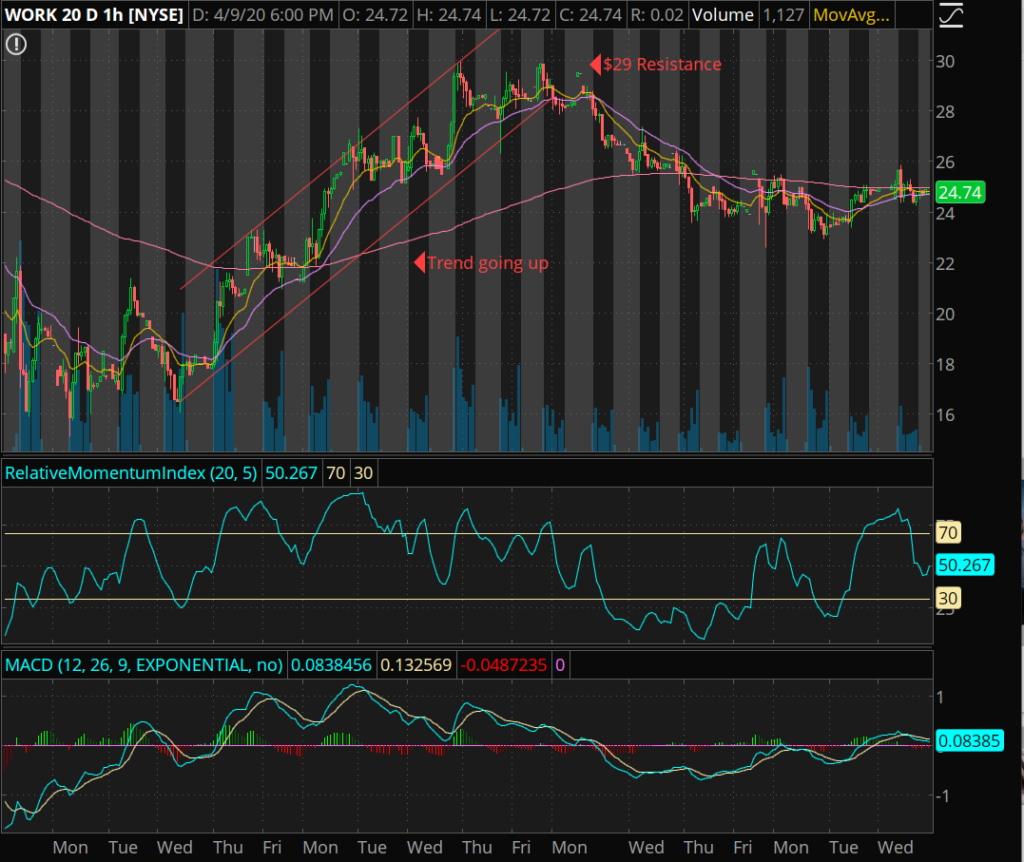
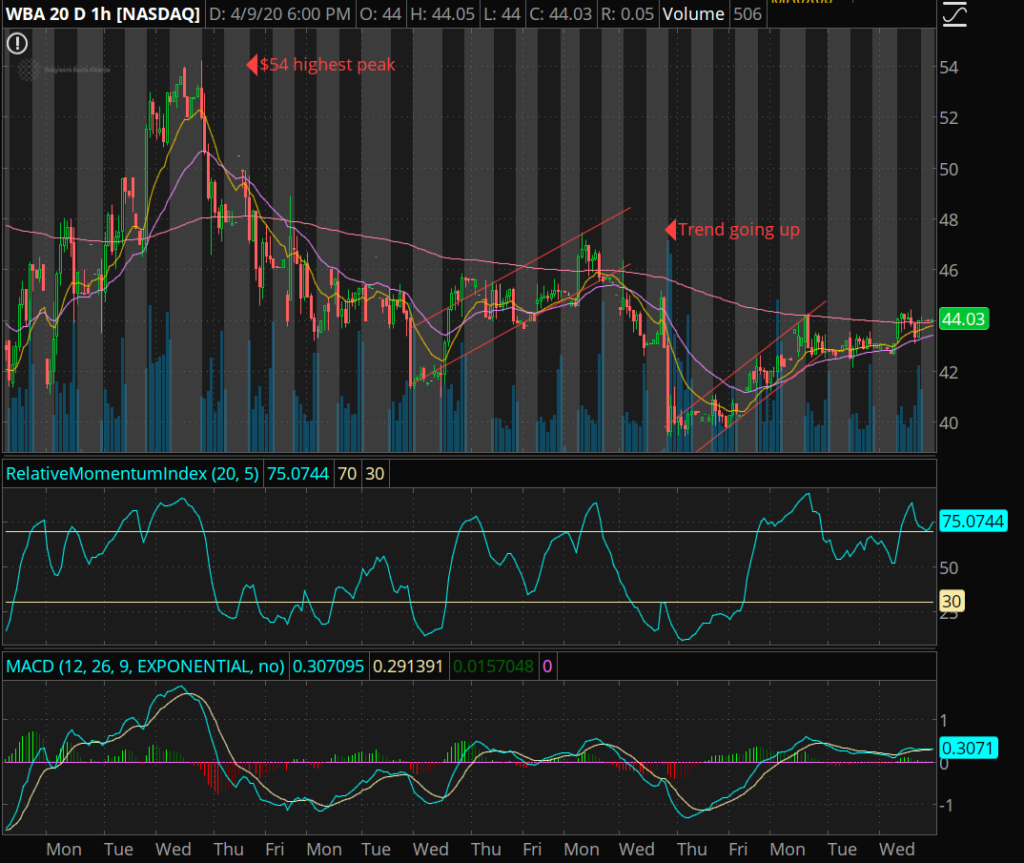
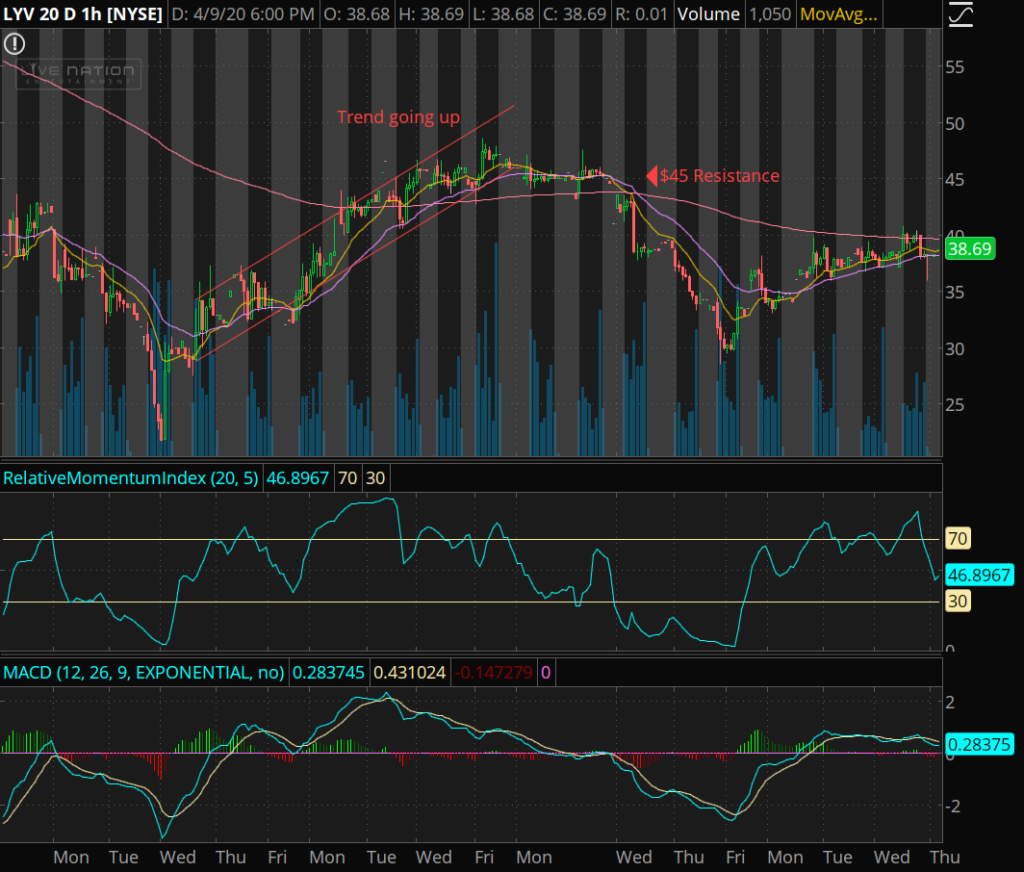
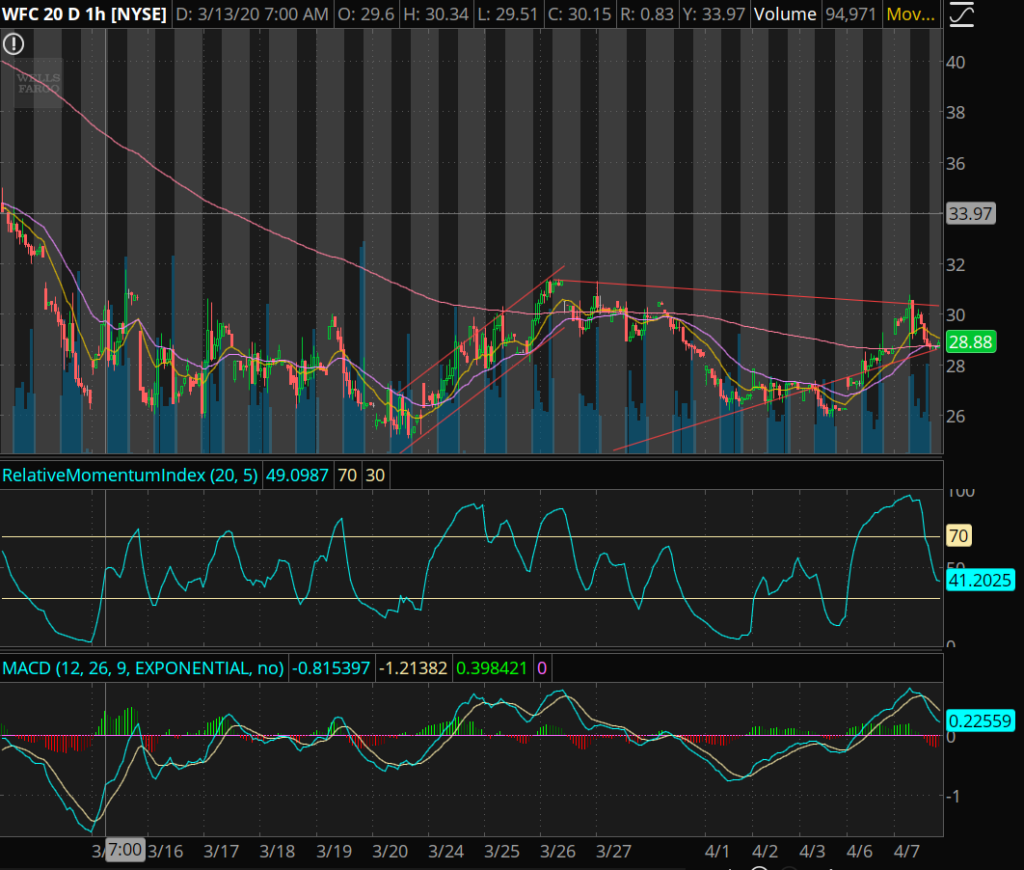
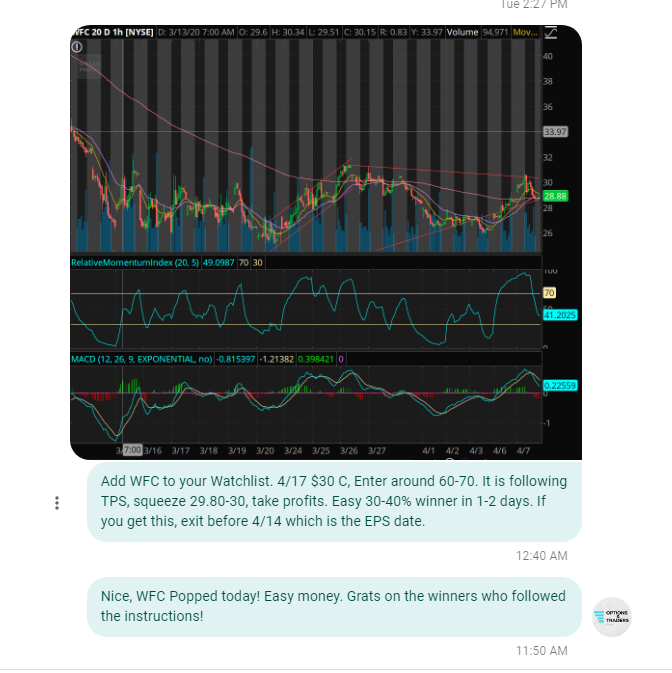
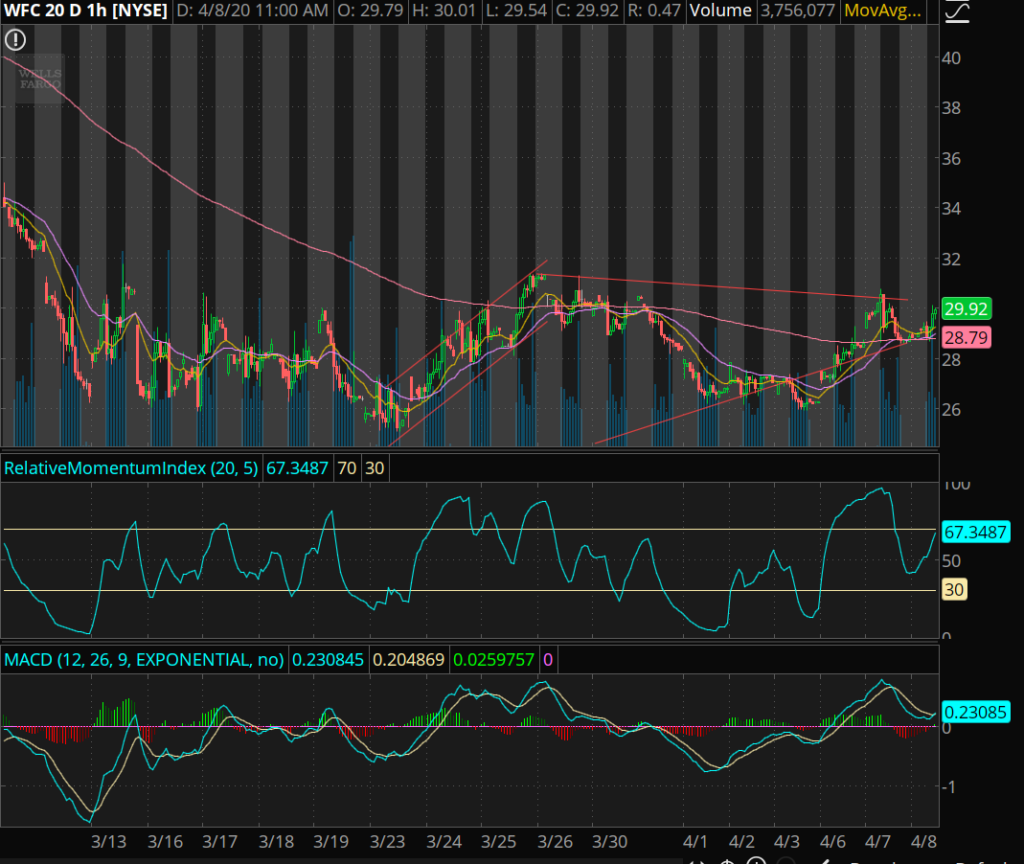
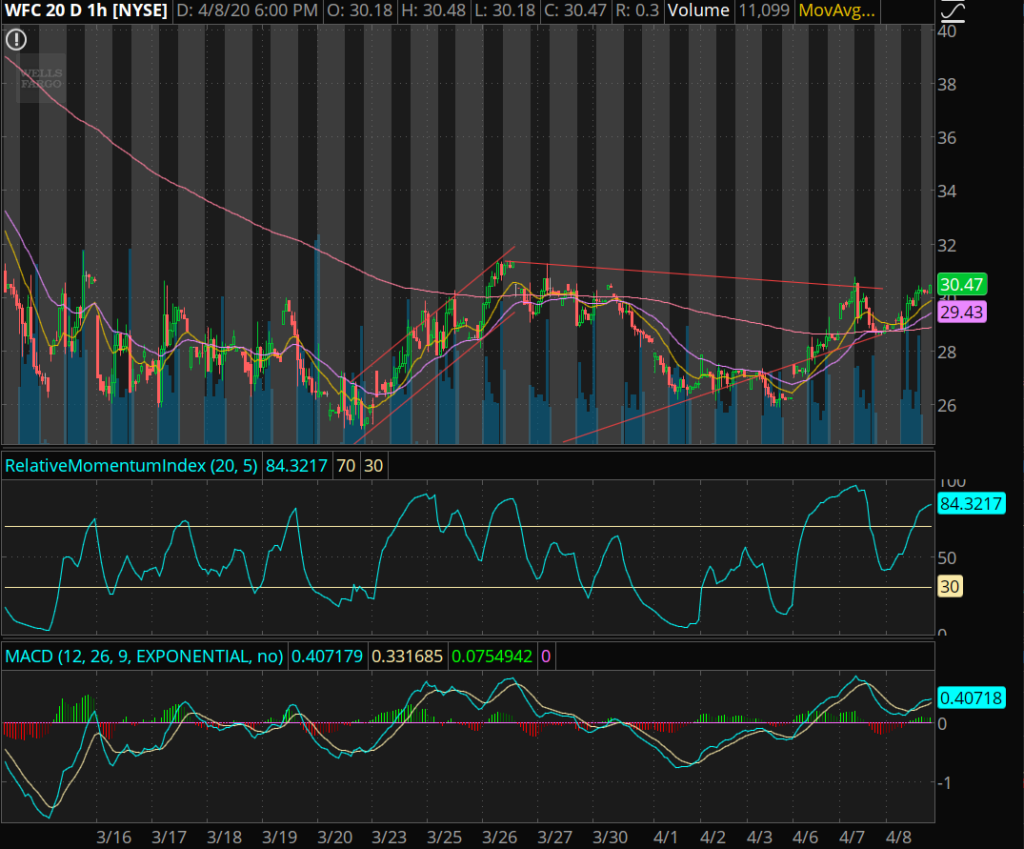
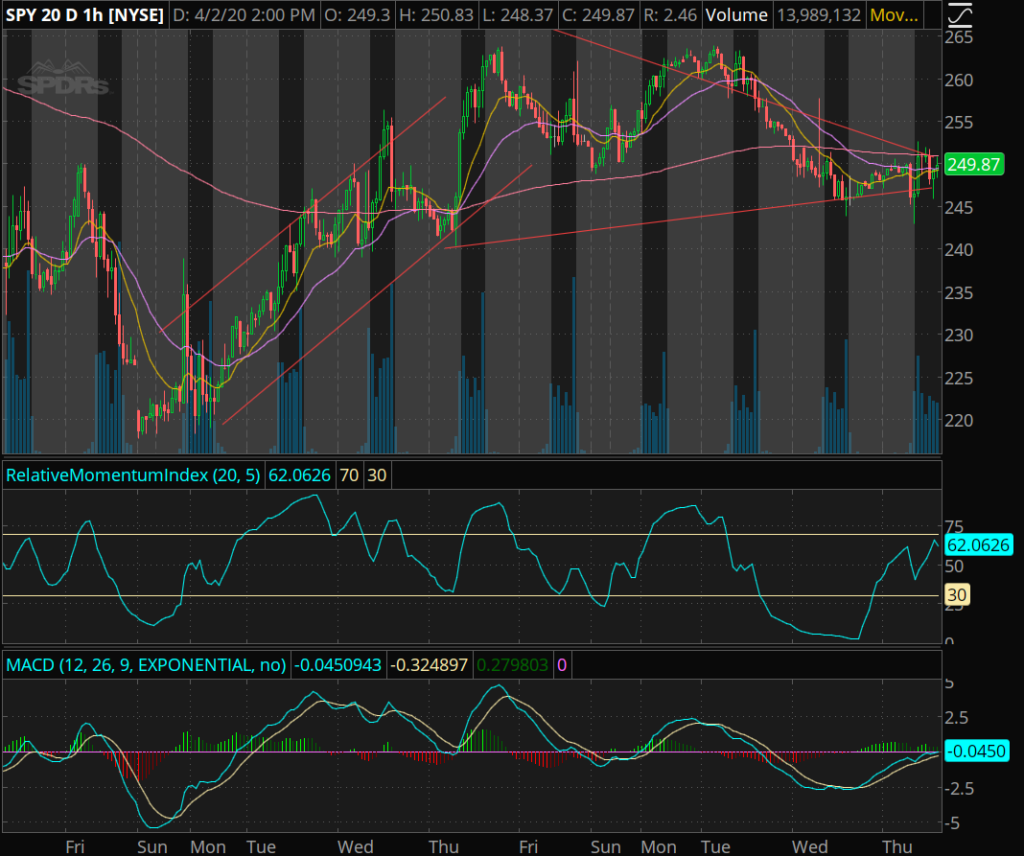
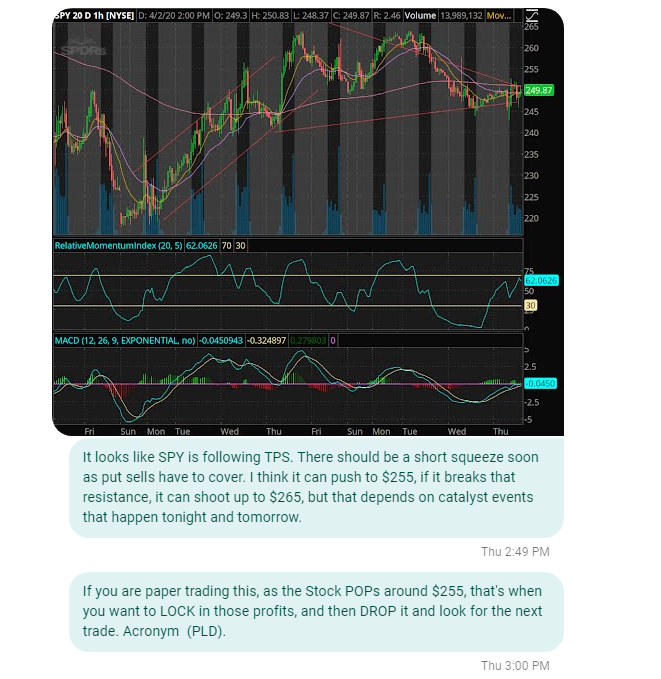
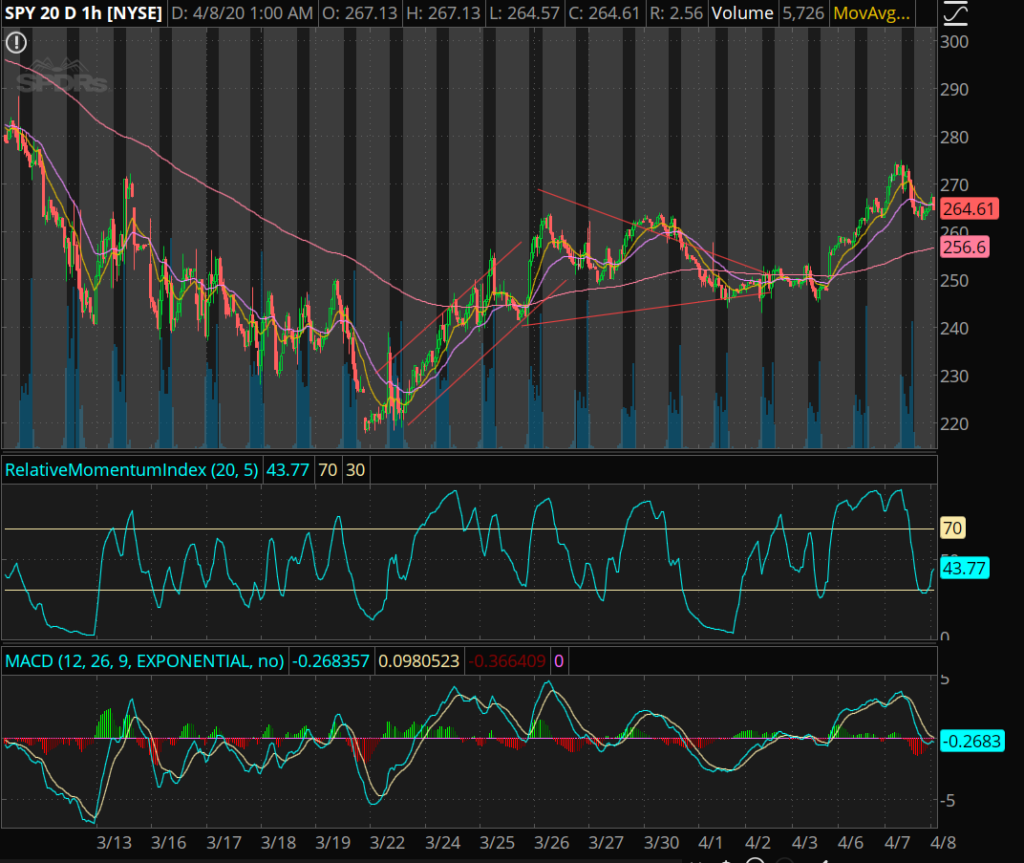
I talk about the indicators that I use and how they can make you more profitable!

If some of these technical indicators are new to you, check out the videos tab on the website!

Stay tuned, learn more, ask questions. Become a 6 digit survivor. Check out the live stream.

Get Started Today

Join my robinhood team and get a free stock here

Learn about my Indicators here.

Become a member and learn!

Newsletter Signup

Disclaimer:

I want to point out, I am not a registered investment adviser or broker/dealer. I am a highly profitable options trader who has been successful time after time, and I have changed the lives of many people through the art of trading on the stock market.

– Ken

Filed Under: COVID19, Day Trade, Education, Key to Success, Mentor, Millionaire Mindset, SPY, Trade, Watchlist Tagged With: COVID19, Options, profit, refresher, stocks, Trading, Training, Watchlist

How This One Indicator Can Give You an Edge and Simplify Your Trading Game!

May 17, 2020 by OptionsAndTraders

Good Afternoon,

I want to talk to you guys about this awesome indicator that I started using. It is really helping me seal the deal when I trade options on the stock market.

The indicator I am talking about is called the TTM_Squeeze.

The TTM_Squeeze is the trailing twelve months squeeze indicator.

It uses Bollinger Bands and Keltner’s Channels.

I don’t want to go into details about how the Bollinger Bands and Keltner’s Channels work, because you really don’t need to know that much detail to understand the mechanics of this indicator.

There are 3 things you need to know to understand how the TTM_Squeeze works.

The first thing you need to know is the buying signal, this is indicated by blue bars. In this phase, the stock is being bought more than it is being sold.

There are two types of blue bars: cyan colored bars and dark blue colored bars.

The cyan colored light blue bar indicates the stock is heavily being bought. The stock price should be rising very fast in this phase.

The dark blue colored bars means that the buying is starting to slow down a bit. The stock price will slowly rise in this phase. It is often a sign that the reversal is about to happen, and there will be a sell off soon.

The second thing is the selling signal. This is the opposite of the buying signal. More selling is happening than buying and the stock price should be dropping.

There are two colors for this indicator: red colored bars and yellow colored bars.

The red colored bars indicate the stock is heavily being sold. This should tank the stock price.

The yellow colored bars indicate that the stock selling is slowing down. The stock price won’t be dropping as fast. This is often a sign that the reversal is about to happen, and there stock will be bought back up soon.

The third thing you need to know is the height of the bars. When you see the blue bars with a taller height, the intensity of the buying is a lot higher. Taller red and yellow bars means that the intensity of the selling is a lot higher.

The opposite occurs when the height of the bars is short. When you see short blue bars, the intensity of the buying is a lot lower. When you see short red and yellow bars, the intensity of the selling is a lot lower.

Sometimes there is a pause in between the different color bars. This results in consecutive red dots. The red dots indicates a pause in the stock price. This is a period of consolidation. In other words, the buying and selling phases are in equilibrium.

Depending on news catalysts, the relative momentum index, and buying patterns, you can use this pause period to predict if the stock is going to continue going up or continue going down.

As long as the SPY is going up, the pause period usually transitions into another buying phase. In most cases, the stock should continue going up.

It is the opposite if the SPY is going down, the pause period usually transitions into another selling phase. In most cases, the stock usually begins to crash.

Take a look at the colored bars on the chart below.

You will see how the different colored bars follows the direction of the stock price.

Source: thinkorswim

Take a look at my video for additional TTM_Squeeze help.

Stay tuned, learn more, ask questions. Become a 6 digit survivor. Check out the live stream.

Get Started Today

Join my robinhood team and get a free stock here

Learn about my Indicators here.

Become a member and learn!

Newsletter Signup

Disclaimer:

I want to point out, I am not a registered investment adviser or broker/dealer. I am a highly profitable options trader who has been successful time after time, and I have changed the lives of many people through the art of trading on the stock market.

– Ken

Filed Under: COVID19, Education, Mentor, Millionaire Mindset, SPY, Trade Tagged With: Mentor, OptionsandTraders, robinhood, SPY, Trade, Trade Pattern, Trades, TTM_Squeeze

How My Top 5 Stocks for April Will Stop You from Feeling Broke! Exclusive Trade Leak! COVID-19 Stock Stimulus. (Free Watchlist).

April 11, 2020 by OptionsAndTraders

Ken Here.

We are officially on Day 22 of quarantine – the impacts of the pandemic hasn’t finished its course.

I know that a lot of you have given up hope, because you loss your job. Times are tough, and the struggle is real. There aren’t a lot of places hiring right now, and you still have to pay the bills, I understand this completely.

My solution is quite simple, trade and make money on the stock market!

There are 5 major reasons why I always recommend and teach trading:

  1. You do not have to create any content.
  2. You do not have to talk to any negative customers.
  3. Nobody can tell you to go home or take a break. You are your own boss.
  4. Nobody schedules your hours, you work when you want to and with whom you want to. (The only limit is the market hours: 8:30 AM CST to 4:00 PM CST.)
  5. The amount of pay you receive has NO LIMIT, you aren’t limited to a measly $500 a week paycheck.

Before we begin, these are 4 essential thoughts on my mental checklist:

  1. Do we have a plan? – Yes, I will lay out the plan on each of these trades.
  2. Why am I getting into this trade? – Each trade will be justified by my key elements.
  3. Do I have an exit strategy? – I will clearly define the exit strategy.
  4. Did I check the size of my position? – Do not enter a trade with more than you are willing to lose, this only creates financial stress and lack of sleep from worrying about your doubts.

Disclaimer:

I want to point out, I am not a registered investment adviser or broker/dealer. I am a highly profitable options trader who has been successful time after time, and I have changed the lives of many people through the art of trading on the stock market.

Nothing is 100% guaranteed on the market, but these are my highest conviction trades for April 2020. I will write another report showing the results of how these trades pan out.

Don’t forget to ignore the trolls.

Most websites and forums post a bunch of lousy irrelevant crap with tons of technical analysis. I believe these posts are full of noise created by a bunch of trolls. If you have ever visited www.stocktwits.com or wallstreetbets you probably have seen them. If you have ever asked a professional trader what they think about these sites, I can guarantee they will all tell you the same thing. “I ignore what other people say, and I do my own due diligence based on my trading edges.”

The explanations of these trades are going to be as concise and crafted as simple as possible.

I will never write such an in-depth watchlist again, so pay close attention.

Traders pay over $10,000 a year for this type of knowledge.

These trades are all going to be swing trades, meaning you can take your profits anywhere from 1 day to 5 days. Take your winnings as soon as you feel comfortable doing so, I am going to define price targets, but you can always take the win a lot sooner.

These are trades which could be affected by Monday’s market volatility, so be cautious if the SPY opens low. Currently, the SPY is trending upwards, so always make sure the SPY isn’t crashing before entering trades.

Source: thinkorswim

Once again I believe these are good stocks to buy and trade.

Let’s dive right in.

Add these 5 stock tickers to your trading platform:

I am going to be trading these stocks starting Monday 4/13/20.

  1. STOR – STORE Capital Real Estate Investment Trust Company
  2. DAL – Delta Air Lines
  3. WORK – Slack Technologies Software Company
  4. WBA – Walgreens Boots Alliance Retail Pharmacy Company
  5. LYV – Live Nation Entertainment Company

STOR

STOR use to be priced at $40 before the pandemic, it is currently trading at $18 (45% of its value).

The Dividend yield is sitting at 7.6% which is pretty high for an annual return (This is attractive for long term investors).

The last traded closing volume was 14 million shares. Multiply this by the share price and you will notice there is tons of money flowing in and out on this stock.

Look at the chart.

Source: thinkorswim

I used 5 elements here:

  1. Gravitational theory – The stock price is getting pulled towards that pink line.
  2. Expanding volume bars – Indicates more and more people are buying the stock.
  3. Support and Resistance – The stock has a support level of $15, and a Resistance level of $20.
  4. RSI
  5. MACD

You have two options here. Buy the stock or buy the option.

Stocks: You own a share which has no expiration date, theoretically it can drop, but it most likely will never go to $0 before you have a chance to sell it.

Options: You own the right to purchase 100 shares per option, but do not own a share. If it expires out-of-the-money it will be worth $0.

Stock: I would purchase this stock around $18.80 to $19.20. I would sell the stock as soon as it reaches $20.50 to $21. This would yield a $2 a share profit.

Options: I would go with a $20 Call with the expiration date of 4/17 for around $0.45 ($45 each) if you want to have a high risk high reward trade. If you want to be safer, purchase the 5/15 $20 Call for around $1.35 ($135 each). I would sell these options as the stock price reaches $20.50 to $21. This would yield about a 100% profit, or doubling your money.

You can use this Options Profit Calculator to see an estimate of how much money you can make per successful trade.

Let’s provide a scenario: I buy one $20 Call contract for $135 with a 5/15 expiration. When the price hits $21, I can turn around and sell that call for $272. This will yield a profit of $137.

The stock option is safer, but the yield is significantly less. I am an options trader, so I am going to trade the option.

Stop loss price: If the stock price is about to close near $17, I will sell my options at a loss to prevent further losses.

DAL

DAL use to be priced at $63 before the pandemic. It is now at $24 (38% of its value).

The dividend is at 6.6% which is attractive to long term investors.

The last traded volume was 91 million shares.

Look at the chart.

Source: thinkorswim

I used 5 elements here:

  1. Gravitational theory – The stock price is getting pulled towards that pink line.
  2. Expanding volume bars – Indicates more and more people are buying the stock.
  3. Support and Resistance – The stock has a support level of $20, and a Resistance level of $32.
  4. RSI
  5. MACD

Again, you have two types of trades here. Buy the stock, or buy the option.

Stock: I would purchase this stock anywhere from $25.40 to $26. I would sell it as it approaches $28 to $29.

Option: I would purchase the $28 Call with the expiration date of 5/1 around $1.30 ($130 each). I would sell the options as the stock price reaches $28 to $29.

This trade has the potential to have a 300% return or 3x your money.

Stop loss price: If the stock price is about to close near $24, I will sell my options at a loss to prevent further losses.

WORK

WORK recently had its IPO this year. So it doesn’t have a defined high. However, it is making a significant impact for companies that require their employees to work from home due to social distancing.

The last traded volume was 10 million shares.

Look at the chart.

Source: thinkorswim

I used 5 elements here:

  1. Gravitational theory – The stock price is getting pulled towards that pink line.
  2. Trend Pattern Squeeze – The stock is trending up, there is a consolidation. The next phase is a squeeze past the gravitational line.
  3. Support and Resistance – The stock has a support level of $24, and a Resistance level of $29.
  4. RSI
  5. MACD

Stock or the option?

Stock: I would purchase this around $24.80 to $24.90, and sell it as the price goes towards $26.

Option: I would purchase the $26 Call with the expiration date of 4/24 around $0.80 ($80 each). I would sell the options when the stock price hits $26.

This will yield about a 200% return or double your money!

Stop loss price: If the stock price is about to close near $23, I will sell my options at a loss to prevent further losses.

WBA

WBA use to be priced at $62 before the pandemic. It is trading at $44 (70% of its value).

The dividend is 4.16% which isn’t super high, but the stock is relatively stable compared to the market. This is what conservative investors typically buy, and there are lot of those type of people.

The last trading day had 7 million shares traded.

Look at the chart.

Source: thinkorswim

I used 5 elements here:

  1. Gravitational theory – The stock price is getting pulled towards that pink line.
  2. Trend Pattern Squeeze – The stock is trending up, there is a consolidation. The next phase is a squeeze past the gravitational line.
  3. Support and Resistance – The stock has a support level of $42, and a Resistance level of $44.
  4. RSI
  5. MACD

Stock: I would purchase this stock between $44 and $44.20 and sell it as the stock goes to $46.50

Option: I would purchase the $45 Call with the expiration date of 4/24 around $1.25 ($125 each) and sell the options around $46.60.

This will yield about a 50% return or 1.5x your money. It is a more conservative stock, so the volatility is lower, but so is the risk.

Stop loss price: If the stock price is about to close near $42, I will sell my options at a loss to prevent further losses.

LYV

LYV use to be priced at $71 before the pandemic. It is now at $38 (53% of its value).

The last trading day had 6 million shares traded.

Look at the chart.

Source: thinkorswim

I used 5 elements here:

  1. Gravitational theory – The stock price is getting pulled towards that pink line.
  2. Trend Pattern Squeeze – The stock is trending up, there is a consolidation. The next phase is a squeeze past the gravitational line.
  3. Support and Resistance – The stock has a support level of $38, and a Resistance level of $45.
  4. RSI
  5. MACD

Stock: I would purchase this stock between $38.40 and $38.80 and sell it as the stock goes to $42.

Option: I would purchase the $42.50 Call with the expiration date of 5/15 around $2.25 ($225 each) and sell the options around $43.

This is a longer swing trade, but it has the potential to make a 200% return, or a double your money trade.

Stop loss price: If the stock price is about to close near $37.50, I will sell my options at a loss to prevent further losses.

Stay tuned, learn more, ask questions. Become a 6 digit survivor. Check out the live stream.

Get Started Today

Join my robinhood team and get a free stock here

Learn about my Indicators here.

Become a member and learn!

Newsletter Signup

Disclaimer:

I want to point out, I am not a registered investment adviser or broker/dealer. I am a highly profitable options trader who has been successful time after time, and I have changed the lives of many people through the art of trading on the stock market.

– Ken

Filed Under: DAL, LYV, SPY, STOR, Trade, Watchlist, WBA, WORK Tagged With: COVID19, DAL, LYV, SPY, Stimulus, STOR, Trade, Watchlist, WBA

What You Should Know About Investing in Banks While Trying to Grow Your Wealth

April 9, 2020 by OptionsAndTraders

Banks are always asking you to invest your money with them. They offer you bonuses, cash back, and other perks to get you to become a member.

You may have fallen for one of these tactics, and I don’t blame you. After all, you do need a bank to house the money you make from your day job.

Have you ever wonder why the banks want you to make an account and deposit your money?

Banks use your hard earned money to play the stock market and generate an enormous amount of wealth while offering you about 1-2% annual interest if you are lucky enough to swing one of those deals.

You can find out how much banks will give you in interest with this tool:

https://www.bankrate.com/banking/savings/rates/

Now that the truth is out. . . Banks NEED your money to make MONEY!

My answer to the question above is:

I never invest in banks, but I might trade their ticker on the stock market. I use their services to temporarily hold my cash as I get paid from my day job. It is a means of transportation for my money. Think of it like public transportation. You have to pay your fare in order to take a ride, and at the end of the day, you might save more money than you would if you drove your own car.

For most of us, we don’t really save or make any money using this form of transportation.

The biggest perk with taking this bus is convenience, you don’t have to drive!

So why am I talking about banks? Well, banks are dependent on your money to make money. The stock price of a bank is directly proportional to the economy, because people store their money in banks when the economy is good; and they take their money out of banks and foolishly invest it all in gold when the economy is bad.

If you read the previous article about the SPY, you will notice that the SPY had a huge squeeze which drove the price higher, and the SPY shows a good representation of how the economy is doing. As of today the SPY hit a high of $276. That is an insane movement for just 1 trading day. This generally implies that the economy is starting to pick back up!

As I was saying, banks are directly proportional to the economy . . .

This is a graph of the stock ticker WFC, which is Wells Fargo Bank. I am sure you have heard or seen this company around.

Source: thinkorswim

I used my 5 key elements to pin point this trade alert:

  1. Gravitational Theory
  2. Trend Pattern Squeeze
  3. Support and Resistance
  4. MACD
  5. RSI

This is what the alert to my students looked like:

This is what happened today:

Source: thinkorswim 4/8/20 11:50 AM CST

BOOM!

In just one day, the stock popped up way high, it is actually trading after-hours at $30.47. That is an insane movement, so had you gotten this alert and purchased those 4/17 $30 calls for about $60 ea, you would have gotten a $150 return per option contract in 1 day!

Think about it, that is 250% in just 1 day! In other words 2.5x. That is enough to turn $1000 into $2500 in just one day of trading!

My students will be exiting the trade tomorrow and making EASY money!

This is the after-hours graph:

Source: thinkorswim

I look forward to writing a report everyday as my students get closer and closer to making $100,000 this year!

Stay tuned, learn more, ask questions. Become a 6 digit survivor. Check out the live stream.

Get Started Today

Join my robinhood team and get a free stock here

Learn about my Indicators here.

Become a member and learn!

Newsletter Signup

Disclaimer:

I want to point out, I am not a registered investment adviser or broker/dealer. I am a highly profitable options trader who has been successful time after time, and I have changed the lives of many people through the art of trading on the stock market.

– Ken

Filed Under: Banks, SPY Tagged With: Banks, Money, SPY, Trades, WFC

How to Stop Being Broke by Knowing What Direction the Market is Heading

April 8, 2020 by OptionsAndTraders

“Hey! Is the stock market going up or down?”

This is the number one question I get asked every time I mention that I trade stocks and options on the stock market.

My answer is always the same. The market will go where ever the market feels like going, and It doesn’t really matter which direction it is going. All you have to do is know in the short term, what direction the market is going, and exploit the quick gains.

Besides that, it is illegal to have inside information and know exactly which direction the market is heading.

Learn about insider trading here: https://www.investopedia.com/terms/i/insidertrading.asp

Warren Buffet said that the market is a giant pile of money that is constantly getting shuffled around. This is the case for the stock market, people are always putting their money in, and taking their money out. This causes stock prices to fluctuate up and down.

Today, I want to discuss the market as a whole for the past two weeks. The stock ticker SPY is a SPDR ETF which is composed of the top 500 companies listed on the stock market. This is also referred to as the S&P 500. There are other ETFS, but I want to focus on this one, because I use this one to get a feel for which direction I think the market is going next so that I can exploit some easy money and quick wins!

This chart was generated by thinkorswim for the SPY ticker from Friday 3/13/20 to Thursday 4/2/20.

I used 5 elements to identify and predict the next move for this stock.

  1. MACD
  2. RSI
  3. Gravitational Theory
  4. Trend Pattern Squeeze
  5. Support and Resistance

These elements are taught in my short video lectures for students of the January 2020 class. I also teach them on a daily basis as I enter and exit trades.

As soon as I saw these 5 elements, I alerted my students about the trade, and gave clear instructions on what to do. This is a preview of what the alert looked like.

Keep in mind, this is all on 4/2/20.

Look at what happened in the next few days.

The SPY followed the squeeze, rapidly exploded to $255 from $249 the very next trading day. The day after, it hit a high of $275! If you would have known that this was going to happen, you could have turned $400 into $2400 in 3 days by playing the call option on the 4/17 SPY $255 C.

Keep in mind, that is a 600% win per option contract. If you had $2000 or 5 contracts, this would have turned into $12,000 in 3 days!

Overall, I am very happy that some of my students were able to make use of the short squeeze and make some quick and easy money!

Happy Trading! I will try and regularly write reports similar to this so that we can have a journal of all our trades throughout the year.

Stay tuned, learn more, ask questions. Become a 6 digit survivor. Check out the live stream.

Get Started Today

Join my robinhood team and get a free stock here

Learn about my Indicators here.

Become a member and learn!

Newsletter Signup

Disclaimer:

I want to point out, I am not a registered investment adviser or broker/dealer. I am a highly profitable options trader who has been successful time after time, and I have changed the lives of many people through the art of trading on the stock market.

– Ken

Filed Under: SPY Tagged With: ETFS, SPY, Stock Market, Trades

Primary Sidebar

Footer

Mission

Our goal is to create a dense network of like minded investors who want to share ideas and learn together.

Content

Our team will teach you how to become an angel investor and a stock trader to help you achieve the success you truly deserve.

Philosophy

We help ordinary people build their wealth from the ground up, because everyone deserves to win.

Copyright © 2025 · Options and Traders Network