Hi Founders,
A couple of weeks ago, one of my mentees was struggling with getting a response from investors.
“It seemed like they really liked what we are doing, but at the end of the call, they told me that we were not sure about the deal.”
“And what did you say?” I asked.
“Well, I told them to trust me. I really know this space, and I spent 1 year building this product. I am an expert with 10 years of experience in this industry.”
“Okay, so did you find yourself justifying yourself to them?”
“Yes … I need the money.”
“Okay, do this next time. Say this, “I am curious, what kind of deal are you expecting to find?” This will give you some real insight in what they want.”
Why does this work?
It’s simple, it gets straight to the point.
Investors don’t want to be convinced; they are just too nice to say no.
By asking them questions and digging deeper, you can understand their mindset and identify what they invest in.
Also, this makes them feel like you understand what they want.
It shows them that you care about what they think, and you aren’t just after their money.
Investors DON’T INVEST because they understand your product.
Investors INVEST because they feel like you understand them.
So, you don’t need to elaborate on how great your startup is.
You just ask questions and use empathy.
Once they know that you understand them, they will trust you.
That’s how you increase your potential for closing a deal.
If you found this helpful and want to learn more about an investor sales funnel.
Feel free to contact me and follow me on LinkedIn.
Ken Ma
Strategic Partnerships | AreaHype
————————————————————————————————————————–
Download today!
https://hypex.app/h/download
Check out what we do!
https://areahype.onuniverse.com/
Disclaimer: This is not a paid advertisement.
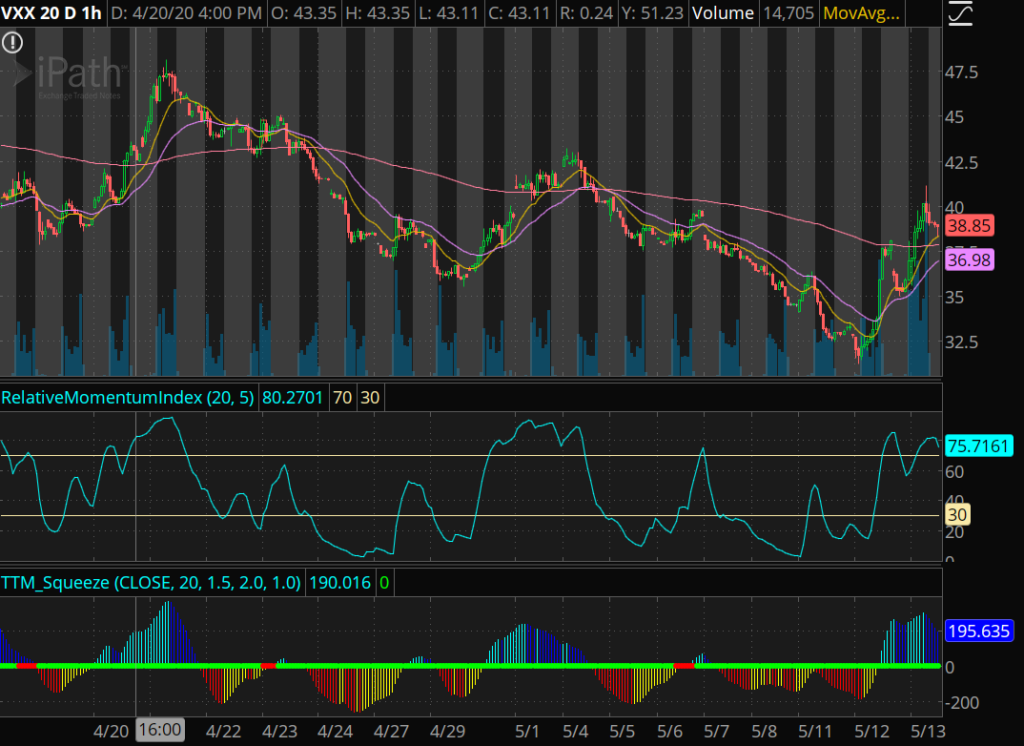
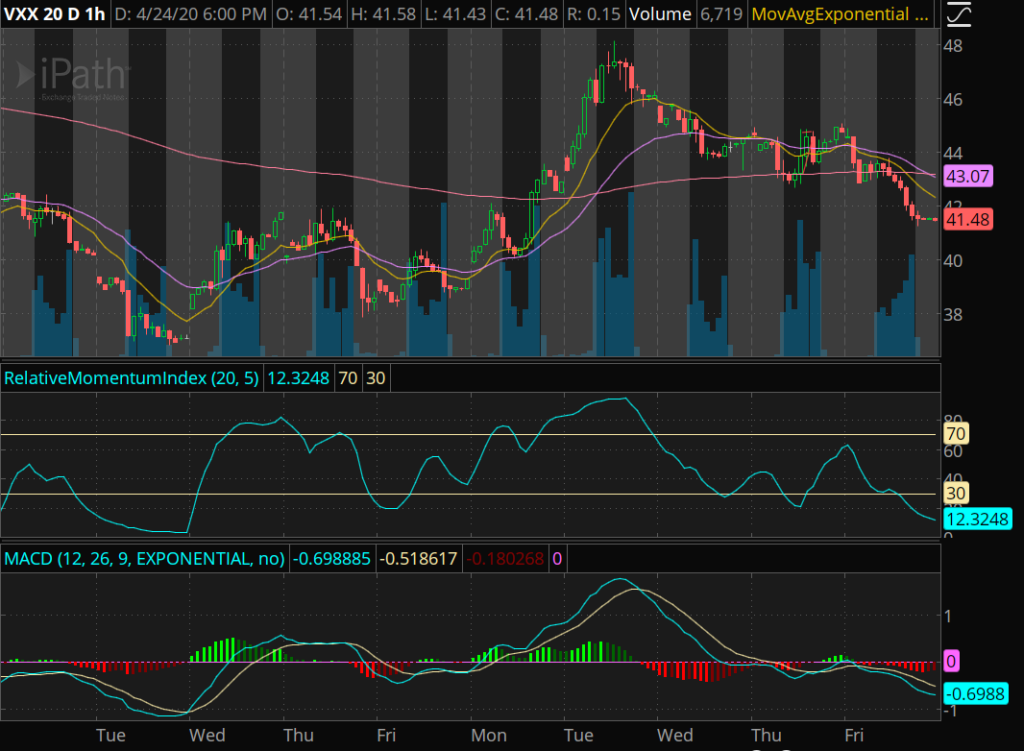
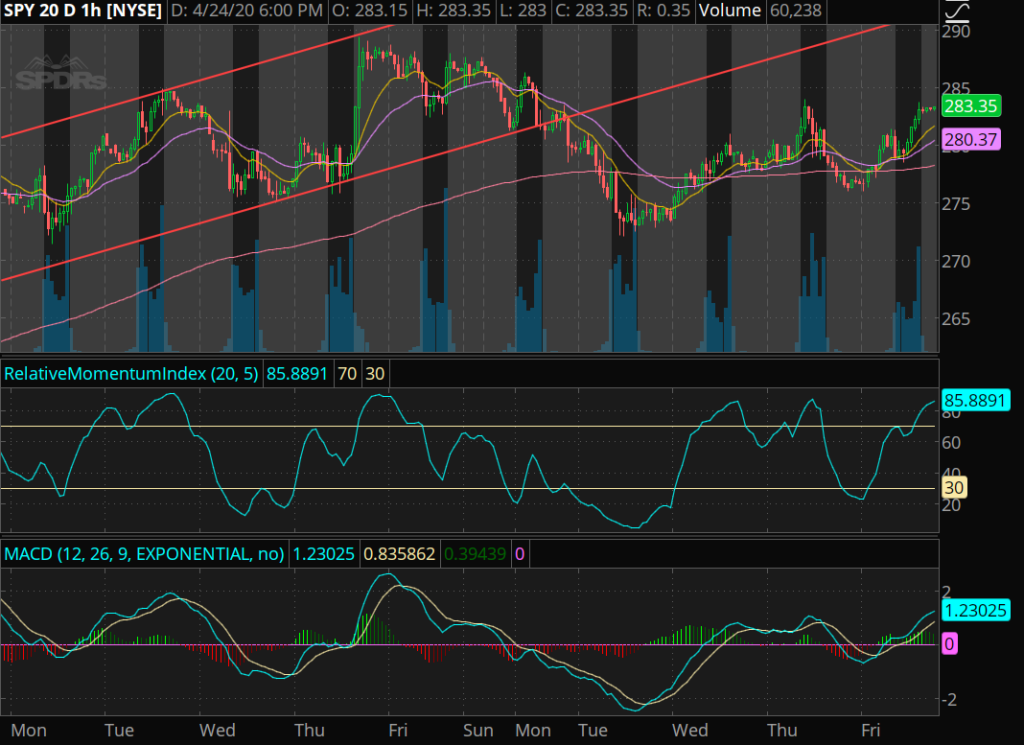
If some of these technical indicators are new to you, check out the videos tab on the website!
Stay tuned, learn more, ask questions. Become a 6 digit survivor. Check out the live stream.
Join my robinhood team and get a free stock here
Learn about my Indicators here.
Become a member and learn!
Disclaimer:
I want to point out, I am not a registered investment adviser or broker/dealer. I am a highly profitable options trader who has been successful time after time, and I have changed the lives of many people through the art of trading on the stock market.
– Ken